Written by Steven Hansen,
For the last several months, the authors of the Cass Freight Index have voiced economic concerns:
While we are still not ready to turn completely negative in our outlook, we do think it is prudent to become more alert to each additional incoming data point on freight flow volume, and are more cautious today than we have been since we began predicting the recovery of the U.S. industrial economy and the rebirth of the U.S. consumer economy in the third quarter of 2016.

Please share this article – Go to the very top of the page, right-hand side, for social media icons
The CASS Freight Index covers air, truck and sea transport. CASS went on to say:
Beyond our concern that the Cass Freight Shipments Index is negative on a YoY basis for the fifth month in a row,
- We are concerned about the severe declines in international airfreight volumes (especially in Asia) and the recent swoon in railroad volumes in auto and building materials;
- We see the weakness in spot market pricing for transportation services, especially in trucking, as consistent with and a confirmation of the negative trend in the Cass Shipments Index;
- As volumes of chemical shipments have lost momentum in recent weeks, despite the rally in the price of WTI crude, our concerns of the global slowdown spreading to the U.S., and the trade dispute reaching a ‘point of no return’ from an economic perspective, grow.
I am a big believer that freight movements are the canary of the economy. And almost all of the transport indicators we follow are contracting or their growth is very soft year-over-year. Transport is saying that economic growth could be better.
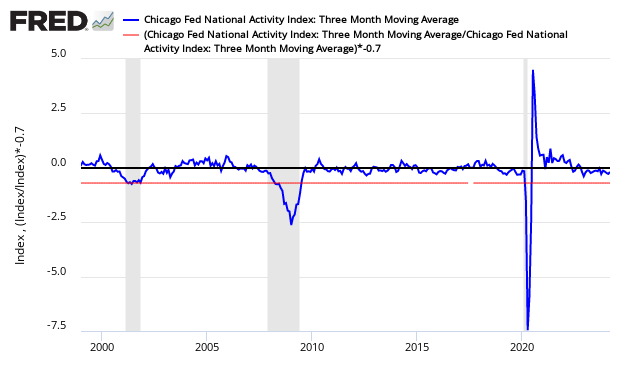
The main coincident indicator I follow is the Chicago Fed National Activity Index (CFNAI) – this week continued to show growth well below the historical rate of growth. Note that the year-over-year rate of growth is significantly contracting and is below the growth rate for any period this decade EXCEPT for recessionary periods.

My normal caveat is that there are few trends or analyses that would indicate a recession is in the cards in the foreseeable future. On the other hand, there still is little to indicate an improving economy is at hand either.
Economic Forecast
The Econintersect Economic Index for May 2019 long term decline began in July 2018 – and continued this month after last month’s marginal improvement. This forecast flies in the face of the continuing improvement trend of Real GDP. There currently is a disconnect between GDP and the Econintersect Economic Index. Part of the reason is that GDP adjusts for trade, and we believe imports are an essential element of economic activity on Main Street. Further, GDP believes economic activity includes inventory, whilst Econintersect ignores inventory. If imports and inventory were ignored – GDP growth would have been less than half of the headline number.

Economic Releases This Past Wee
The following table summarizes the more significant economic releases this past week. For more detailed analysis – please visit our landing page which provides links to our complete analyses.
| Release | Potential Economic Impact | Comment |
|---|---|---|
| April CFNAI | shows slow economic growth | The economy’s rate of growth declined based on the Chicago Fed National Activity Index (CFNAI) 3 month moving (3MA) average – and the economy remained below the historical trend rate of growth. This index confirms for the last several months – the economy has slowed. The single month index which is not used for economic forecasting, and unfortunately is what the CFNAI headlines. Economic predictions are based on the 3-month moving average. The single month index historically is very noisy and the 3-month moving average would be the way to view this index in any event. CFNAI Three Month Moving Average (blue line) with Historical Recession Line (red line)
|
| April Existing Home Sales | n/a | The headline existing home sales declined relative to last month with the authors saying “We see that the inventory totals have steadily improved, and will provide more choices for those looking to buy a home.” The rolling averages for existing home sales have been improving for the last 3 months. This month the rolling averages remained in contraction. Housing inventory is historically low for Aprils. Keep in mind that sales are contracting year-over-year.
|
| April Chemical Activity Barometer | little year-over-year growth | The Chemical Activity Barometer (CAB) rose 0.4 percent in May on a three-month moving average (3MMA) basis, the third monthly gain after several weak months. On a year-over-year (Y/Y) basis, the barometer is up 0.5 percent (3MMA).
|
| 01 May FOMC Meeting Minutes | n/a | Participants continued to view Sustained Expansion of Economic Activity, with Strong Labor Market Conditions, and Low Inflation As the Most Likely Outcome.
|
| April Coincident Indicators | slow economy | Generally, the coincident indices are showing modest growth. Econintersect‘s analysis of the coincident indices is that:
|
| April New Home Sales | strong growth | The headlines say new home sales declined month-over-month. Median and average sales prices improved. This month the backward revisions were significantly upward. Because of weather and other factors, the rolling averages are the way to view this series. The rolling averages improved. The reason for the decline of the month-over-month growth is because of the significant upward revision of data for 2019. The growth in this sector should now be considered strong. Growth in 2019 now exceeds every year since 2007.
|
| April Durable Goods | continues to slow | The headlines say the durable goods new orders declined. Our analysis shows the rolling averages continued its decline. In the adjusted data, the major weakness was civilian aircraft – but most of the data was weak. This series has wide swings monthly so our primary metric is the unadjusted three-month rolling average – which declined. The rate of growth of the rolling averages is below the values seen over the last year. Note that inflation-adjusted new orders are in contraction.
|
| April Trucking | data sources disagree – one is great and the other is contracting | Headline data for truck shipments showed that the American Trucking Association (ATA) tonnage showed continued strong year-over-year growth, but the CASS Freight Index reported the year-over-year growth rate continues to contract. The CASS index is inclusive of rail, truck, and air shipments. The ATA truck index is inclusive of only member movements. I tend to put a heavier weight on the CASS index which continued in contraction year-over-year. On the other hand, the ATA index significantly improved and remains strongly in expansion.
|
| Surveys | low growth | Kansas City Fed Manufacturing – Kansas City Fed manufacturing has been one of the more stable districts and their index even though at the lower end of the range seen in the last 12 months. Note that the key internals were mixed with new orders in expansion and backlog back in contraction. This should be considered a similar report to last month.
|
| Weekly Rail Counts | Definitely not positive news | Rail so far in 2019 has changed from a reflection of a strong economic engine to contraction. Currently, not only are the economic intuitive components of rail in contraction, but the year-to-date has slipped into contraction.
|


Links To All Of Our Analysis This Past Week
include(“/home/aleta/public_html/files/ad_openx.htm”); ?>


