Written by Steven Hansen,
Manufacturing growth in the U.S. continues its decline – and year-over-year growth for capacity utilization has all but disappeared.

Please share this article – Go to the very top of the page, right-hand side, for social media icons
Seasonally Adjusted Capacity Utilization – Year-over-Year Change – Seasonally Adjusted – Total Industry (blue line) and Manufacturing Only (red line)

This week the Federal Reserve released their March 2017 data for manufacturing. and also shows industrial production – manufacturing’s growth at two-year lows:
As there is a general correlation between Real GDP growth and Manufacturing, we should expect weaker Real GDP growth in 1Q2019.

Economic Releases This Past Week
The Econintersect Economic Index for April 2019 insignificantly improved but remains below territory associated with normal expansions. Even with this improvement, the question remains whether this long term downward trend will continue. Note, our index is built on data sets which were not affected by the government shutdown – and it is most likely that other economic forecasts you have seen fudged the missing data.

The following table summarizes the more significant economic releases this past week. For more detailed analysis – please visit our landing page which provides links to our complete analyses.
| Release | Potential Economic Impact | Comment |
|---|---|---|
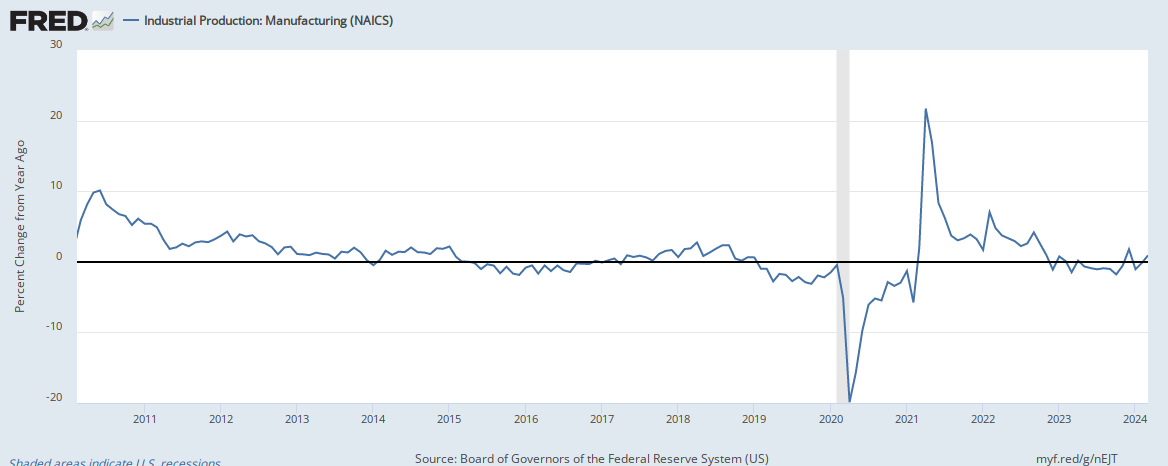
| March Industrial Production | indicates a soft economy | The headlines say seasonally adjusted Industrial Production (IP) declined month-over-month. Our analysis shows the three-month rolling average declined. Note that the manufacturing portion of industrial production is only up 1.0 % year-over-year. IP headline index has three parts – manufacturing, mining and utilities – manufacturing was up 0.0 % this month (up 1.0 % year-over-year), mining down 0.8 % (up 10.5 % year-over-year), and utilities were up 0.2 % (up 3.8 % year-over-year). Note that utilities are 10.4 % of the industrial production index, whilst mining is 14.6 %.
|
| March Trade Data | indicates a weakening economy | Trade data headlines show the trade balance improved from last month – and yet the rolling averages for exports and imports declined.
|
| February Wholesale | indicates a soft economy | The headlines say wholesale sales improved month-over-month with inventory levels worsening and very elevated. Our analysis shows a deceleration of the rate of growth for the rolling averages. Overall, the rolling averages tell the real story – and they declined this month – and are at two-year lows. This sector’s growth continues to trend down. This sector is in contraction if one inflation adjusts the data. Inventory levels this month are at recessionary levels.
|
| Leading Indicators | soft growth | Note that both ECRI and RecessionAlert have improving trend lines. RecessionAlert is projecting the strongest growth of all the indicators. The leading indicators are to a large extent monetary based. Econintersect does not use any portion of the leading indicators in its economic index. Most leading indices in this post look ahead six months – and are all subject to backward revision. Leading Indicators Conclusion: At this point, Econintersect continues to see NO particular dynamic which will deliver noticeably better growth in the foreseeable future – and no indicator is forecasting a recession over the next six months.
|
| April Beige Book | little change in the rate of economic growth | The consolidated economic report from the 12 Federal Reserve Districts (Beige Book) stated: “Economic activity expanded at a slight-to-moderate pace in March and early April“. The previous report stated: “ten Districts reporting slight-to-moderate growth, and Philadelphia and St. Louis reporting flat economic conditions“. After reading the narrative, one gets the feeling of a little change and a slow economy. |
| March Retail Sales | not showing the economy is improving | Retail sales improved according to US Census headline data. Although the three-month rolling average improved, it was slight and the overall long term downward trend remains in play. Please consider that this data is not adjusted for inflation. There is no growth in employment in this sector.
|
February Business Inventories | says the economy slowed | Headlines show final business sales data (retail plus wholesale plus manufacturing) improved. However, the rolling averages declined. Inventories remain very elevated. There is almost no growth if the data is adjusted for inflation.
|
| March Housing Starts | n/a | The headline residential building permits slowed and construction completions improved relative to last month. This data was worse than expected. In summary, the rolling averages say this sector is contracting. We consider this report worse than last month.
|
| Surveys | relatively strong | New York Fed Manufacturing – improved and remains in expansion. Overall this survey remains in the lower range of values seen in the last two years. Philly Fed Manufacturing – declined by remained in expansion. Key elements remained in positive territory. Although the survey index declined, the key element sales significantly improved while unfilled orders significantly declined. Overall, I do not consider this survey much different than last month. |
| Weekly Rail Counts | Definitely not positive news | Rail so far in 2019 has changed from a reflection of a strong economic engine to contraction. Currently, not only are the economic intuitive components of rail in contraction, but the year-to-date has slipped into contraction.
|


Links To All Of Our Analysis This Past Week
include(“/home/aleta/public_html/files/ad_openx.htm”); ?>


