Written by Steven Hansen,
Overall, what struck me this week were the effects of inflation and population. Except for a few data points, the releases from the government agencies showing monetary values are not inflation-adjusted or population-adjusted to determine real growth:

Please share this article – Go to the very top of the page, right-hand side, for social media icons
- the US population is growing by 0.6 % year-over-year;
- depending on the inflation indicator used, the general year-over-year inflation rate is in the range of 2%.
Generally, this means that for REAL growth, the monetary data point must exceed 2.5% year-over-year for there to be real economic growth. And this week both retail sales and construction spending are contracting if one adjusts the data for inflation and population.
Economic Releases This Past Week
The Econintersect Economic Index for April 2019 insignificantly improved but remains below territory associated with normal expansions. Even with this improvement, the question remains whether this long term downward trend will continue. Note, our index is built on data sets which were not affected by the government shutdown – and it is most likely that other economic forecasts you have seen fudged the missing data.

The following table summarizes the more significant economic releases this past week. For more detailed analysis – please visit our landing page which provides links to our complete analyses.
| Release | Potential Economic Impact | Comment | ||||||||||||||||||||
|---|---|---|---|---|---|---|---|---|---|---|---|---|---|---|---|---|---|---|---|---|---|---|
| February Retail Sales | indicates a slowing economy | Retail sales declined according to US Census headline data. Last month’s data was revised upward but the rolling averages continue their downward trend. There was a significant upward adjustment of last month’s data. The real test of strength is the rolling averages which declined. Things to consider when viewing this data:
| ||||||||||||||||||||
| February Construction Spending | indicates a weak economy | The headlines say construction improved month-over-month. Our analysis shows the rolling averages improved. The rolling averages improved – and last month was revised up. However, also note that inflation is grabbing hold, and the inflation-adjusted numbers are in contraction.
| ||||||||||||||||||||
| Coincident Indicators | confirming weaker growth | Econintersect‘s analysis of the coincident indices is that:
| ||||||||||||||||||||
| January Business Sales and Inventories | rising inventories generally indicates a slowing economy | Inventories grew again this month significantly. Our primary monitoring tool – the 3-month rolling averages for sales – declined again but remains in an expansion. As the monthly data has significant variation, the 3-month averages are the way to view this series. Overall business sales are better than the low point in 2015 – but the trend over the last 6 months shows growth is trending down.
| ||||||||||||||||||||
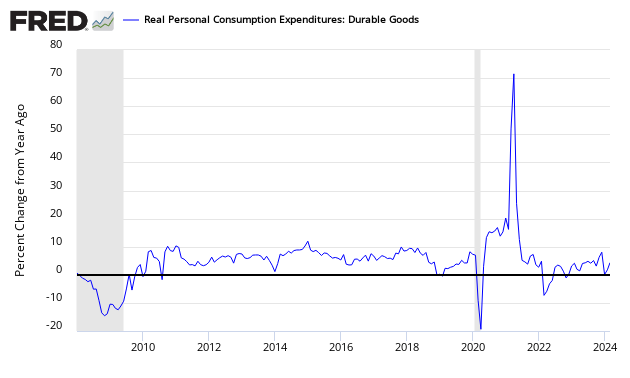
February Durable Goods | confirms a slowing economy | The headlines say the durable goods new orders declined. Our analysis shows the rolling averages continued its decline. In the adjusted data, the weakness was defense and civilian aircraft. This series has wide swings monthly so our primary metric is the unadjusted three-month rolling average – which declined. The rate of growth of the rolling averages is below the values seen over the last year. Note that inflation-adjusted new orders are in contraction.
| ||||||||||||||||||||
| March ADP Employment | n/a | ADP reported non-farm private jobs growth at 129,000 which was below the range of expectations. A quote from the ADP authors:
This month the rate of ADPs private employment year-over-year growth is on the low side of the tight range seen over this year. However, the rolling average of the year-over-year rate of growth remains unchanged for the last 7 months. Last month’s employment numbers were revised upward.
| ||||||||||||||||||||
| March BLS Jobs Report | n/a | The establishment and household surveys seem to have come from different dimensions. For the second month in a row, these surveys which are the basis of the monthly jobs report do not match with one actually contracting and the other growing significantly. The economically intuitive sectors contracted. The rate of growth of the establishment survey was lower than one year ago. The year-to-date growth remains under last year and worsened.
| ||||||||||||||||||||
| February Consumer Credit | n/a | From the Federal Reserve:
Econintersect’s view: Unadjusted Consumer Credit Outstanding
| ||||||||||||||||||||
| Surveys | mixed | Purchasing Managers Manufacturing (PMI) and Markit Manufacturing PMI – Based on these surveys and the district Federal Reserve Surveys, one would expect the Fed’s Industrial Production index growth rate to be around the same level of growth as last month. Overall, surveys do not have a high correlation to the movement of industrial production (manufacturing) since the Great Recession. One manufacturing survey trended higher this month and the other down – but were in general agreement with the regional Federal Reserve surveys
Services ISM and Markit Services PMI – | ||||||||||||||||||||
| Weekly Rail Counts | Definitely not positive news | Rail so far in 2019 has changed from a reflection of a strong economic engine to contraction. Currently, not only are the economic intuitive components of rail in contraction, but the year-to-date has slipped into contraction.
|


This week the data was mixed but little showing an improving economy – and, there is little to indicate that a recession is waiting in the wings, at least not immediately.
Links To All Of Our Analysis This Past Week
include(“/home/aleta/public_html/files/ad_openx.htm”); ?>


