Written by Steven Hansen
The December Consumer Credit shows consumer credit growth remains soft, and if one removes student loans – and adjusts for inflation – then the year-over-year growth is lower than GDP growth. Also this week there are two missed data sets because of the government shutdown were issued.

Please share this article – Go to very top of page, right hand side, for social media buttons.
Unadjusted Consumer Credit Outstanding
| Month- over- Month Growth | Year- over- Year Growth | Month- over- Month Growth without Student Loans | Year- over- Year Growth without Student Loans | |
| Total | +0.1 % | +4.7 % | +0.1 % | +3.3 % |
| Revolving | -0.5 % | +2.0 % | n/a | n/a |
| Non- Revolving | +0.3 % | +5.6 % | +0.4 % | +4.0 % |
Overall takeaways from this month’s data:
- Student loan year-over-year growth rate had been decelerating gradually since the beginning of 2013 – but in the past year, there has been little change in the rate of growth..
- Student loans growth rate (US Government owned) accelerated 0.0% month-over-month and year-over-year growth is 8.0 %. [Note that the data last month was revised upward.
- Revolving credit (e.g.credit cards – and this series includes no student loans) and has been slightly decelerating since Jan 2017.
Let’s take a quick look at consumer credit rate of growth adjusted for inflation. Currently the rate of year-over-year inflation-adjusted consumer credit growth is 2.7% – unfortunately we do not know 4Q2019 real GDP growth – but in 3Q2019 the year-over-year growth was 3.0%.

Overall, it seems consumer credit growth is currently growing at a sustainable rate. However, focusing on student loans only – even though the rate of growth is slowing – it is still growing at an unsustainable rate.
Year-over-Year Growth Rate Student Loans

This past week, the Federal Reserve Bank of St. Louis asked “Is college still worth it?“. The post concluded:
On average – that is, across all birth years, races and ethnicities – college is still worth it in terms of earnings. We found that college and postgrad degree holders generally earn significantly higher incomes than nongrads.
However, for recent generations and for non-white students, the payoffs are somewhat lower than average. This is especially true for wealth accumulation. Considering all of the evidence, we conclude that the conventional wisdom about college is not as true as it used to be.
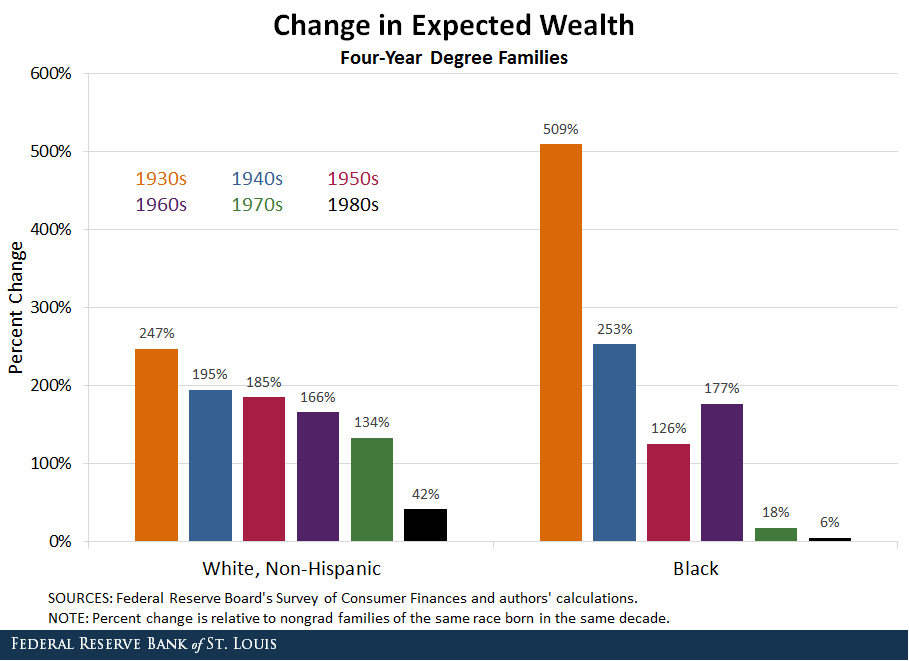
The median net worth of the average college graduate is $292,100. Consider:
According to the College Board, the average cost of tuition and fees for the 2017-2018 school year was $34,740 at private colleges, $9,970 for state residents at public colleges, and $25,620 for out-of-state residents attending public universities.
| Cost of 4 Years | Percent of median net worth for Cost of University / college education | |
|---|---|---|
| private colleges | $138,960 | 48% |
| state residents at public colleges | $39,880 | 14% |
| out of state residents at public colleges | $102,480 | 35% |
My take on the Federal Reserve Bank of St. Louis’ post is that the net worth of college / university graduates is falling because the cost of that education is becoming more dear. Combine this with a large minority of graduates who are working in jobs not requiring a degree – or being educated in subjects which have little demand for these graduates.
When student loans are removed from consumer credit, the inflation adjusted results are growing slower than GDP.

Economic Releases This Past Week
The Econintersect Economic Index for February 2019 insignificantly declined, and remains below territory associated with normal expansions. The question remains whether this downward trend will continue. Note, our index is built on data sets which were not affected by the government shutdown – and it is most likely that other recent economic forecasts you have seen fudged the missing data. A forecast with fudged data is simply a guesstimate.
The following table summarizes the more significant economic releases this past week. For more detailed analysis – please visit our landing page which provides links to our complete analyses.
| Release | Potential Economic Impact | Comment |
|---|---|---|
January Conference Board Employment | n/a | Econintersect evaluates year-over-year change of this index (which is different than the headline view) – growth rate decelerated 1.5 % month-over-month and grew 3.4 % year-over-year. The Econintersect employment index marginally improved. The CB Employment Index was affected by the government shutdown:
Note that Econintersect’s employment index was not affected by the government shutdown. |
| November Factory Orders | Negative economic affect | According to the seasonally adjusted data, there was a general weakness in most areas except defense aircraft which where the major contributors to the decline. The data in this series is noisy so I would rely on the unadjusted 3 month rolling averages which declined. Remember the headline numbers are not inflation adjusted – and when inflation is factored in, there is little YoY growth. Backlog of orders shows no growth if one considering inflation. |
| December CoreLogic Home Price Index | little affect economically | There was a continuation of home price moderation – falling now to 4.7% year-over-year. The authors of this index forecast home prices will increase by 4.6 percent on a year-over-year basis from December 2018 to December 2019 |
| November Trade Data | unknown until next month’s data is released | Trade data headlines show the trade balance worsened from last month – and the rolling averages for exports and imports remained in the ranges seen over the last 12 months. The data in this series wobbles and the 3 month rolling averages are the best way to look at this series. The 3 month averages slowed for exports and imports. Note that the headline numbers are not inflation adjusted – and if one inflation adjusts, the year-over-year growth is less than economic growth. |
| 4Q2018 Productivity | n/a | Data for this report, because of the government shutdown, was limited to manufacturing output which is a tiny element in overall productivity. Basically, this report was worthless this month. |
| December Consumer Credit | marginally negative | In 2018, consumer credit increased 5 percent, with revolving and nonrevolving credit increasing 2-3/4 percent and 5-1/2 percent, respectively. Consumer credit increased at a seasonally adjusted annual rate of 6-1/2 percent in the fourth quarter and at a rate of 5 percent in December. |
| Surveys | Surveys trending lower | ISM and Markit Services Indices both declined this month – and are near the bottom of values seen in the last 12 months. |
| Weekly Rail Counts | ??? | Rail has been flying high in 2019 – and this week (likely due to a holiday mismatch) contracted year-over-year. There is a correlation between rail growth and economic growth. |
This week the data is mixed but predominately showing a slowing economy.
Links To All Of Our Analysis This Past Week
include(“/home/aleta/public_html/files/ad_openx.htm”); ?>


