 Written by Steven Hansen
Headline data for truck shipments showed slowing of growth in June 2018.
Analyst Opinion of Truck Transport
I tend to put heavier weight on the CASS index which continues to show a stronger rate of growth improvement year-over-year.
It should be pointed out that the trucking movements are improving YoY – and the likely reason is the shift from box stores to eRetailers.
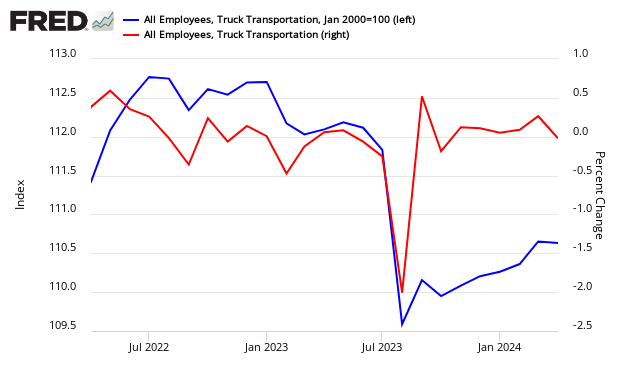
Econintersect tries to validate truck data across data sources. It appears this month that jobs growth says the trucking industry employment levels rate of growth slowed in June – which is consistent with both ATA and Cass. Please note using BLS employment data in real time is risky, as their data is normally backward adjusted (sometimes significantly).
ATA Trucking
American Trucking Associations’ advanced seasonally adjusted (SA) For-Hire Truck Tonnage Index fell 0.4% in June after rising 0.4% in May. In June, the index equaled 113 (2015=100), down from 113.4 in May.
Said ATA Chief Economist Bob Costello:
In the second quarter, we saw the tonnage index jump 1.8% from the previous quarter and 8.4% from a year earlier. This robust growth fits with what is likely to be a very strong GDP reading for the second quarter. I expect the growth in tonnage to moderate, but remain at very high levels in the months ahead.
ATA Truck tonnage this month

z truck.png
Compared with June 2017, the SA index increased 7.8%, up from May’s 7.4% year-over-year increase. Year-to-date, compared with the first half of last year, tonnage increased 7.9%, far outpacing the annual gain of 3.8% in 2017.
source: ATA
CASS FREIGHT INDEX REPORT
Volume Strong, Pricing Even Stronger – Has Infrastructure Reached Short-term Limit?
z truck2.png
From both a volume and a pricing perspective, the U.S. freight economy continues to be extraordinarily strong. The Cass Freight Shipments and Expenditures Indices are clearly signaling that the U.S. economy, at least for now, is ignoring all of the angst coming out of Washington D.C. about the trade war. Despite concerns coming out of Wall Street about the increased threat of inflation or the continued increase in interest rates, these indices are displaying accelerating strength on top of increasingly difficult comparisons. Demand is exceeding capacity in most modes of transportation by a significant margin. In turn, pricing power has erupted in those modes to levels that continue to spark overall inflationary concerns in the broader economy. With all of this positive news taken into account, we are seeing signs that the transportation infrastructure has reached its limit, at least in the short-term, to accommodate higher rates of volume growth. As we explained in previous months, we do not fear longer-term inflationary pressure given that technology provides multiple ways to increase asset utilization and price discovery in all parts of the economy, especially in transportation. In fact, we are seeing more signs that ELDs (Electronic Logging Devices), which initially hurt the capacity/utilization of truckers (especially small truckers) are now beginning to contribute to gains in equipment utilization. This is especially true in the Dry Van and Reefer (temperature control) marketplaces of trucking, while the Flatbed segment of trucking is continuing to struggle with productivity since the adoption of ELDs.


z truck1.PNG
Source: http://www.cassinfo.com/Transportation-Expense-Management/Supply-Chain-Analysis/Cass-Freight-Index.aspx
include(“/home/aleta/public_html/files/ad_openx.htm”); ?>


