
by Jill Mislinski, Advisor Perspectives/dshort.com
The University of Michigan Final Consumer Sentiment for January came in at 95.7, up 0.2 from the December Final reading of 95.9. Investing.com had forecast 95.0.

Surveys of Consumers chief economist, Richard Curtin, makes the following comments:
Consumer sentiment has remained largely unchanged for more than a year at very favorable levels. The January Sentiment figure was just 0.2 Index-points below December’s, and just 1.1 points below the 2017 average of 96.8–which was the highest yearly average since 2000. Stock price increases and the passage of tax reforms were mentioned by all-time record numbers of consumers. To be sure, there were small offsetting declines among lower income households and residents of the Northeast. Consumers continued to expect growth in jobs and incomes, but anticipated a slightly higher inflation rate. Importantly, the motivating force behind purchase decisions has shifted from discounts on prices and interest rates to increased confidence in future job security and growth in wages as well as financial assets. This renewed sense of confidence was responsible for the recent declines in savings rates. The tax cuts will increase discretionary spending once higher energy bills due to the unusually cold weather are paid. Monetary policy will need to tighten in the year ahead, but given consumers’ decade long experience with record low interest rates, only modest increases in interest rates will be sufficient to curb any excesses. Overall, the data signal an expected gain of 2.8% in real personal consumption expenditures during 2018. [More…]
See the chart below for a long-term perspective on this widely watched indicator. Recessions and real GDP are included to help us evaluate the correlation between the Michigan Consumer Sentiment Index and the broader economy.
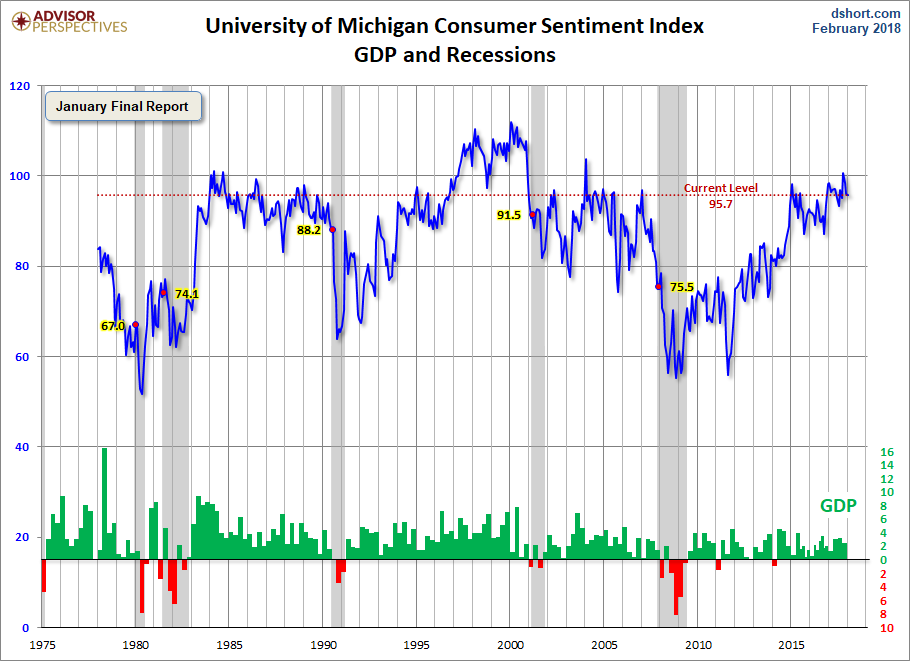
To put today’s report into the larger historical context since its beginning in 1978, consumer sentiment is 11.6 percent above the average reading (arithmetic mean) and 12.9 percent above the geometric mean. The current index level is at the 80th percentile of the 481 monthly data points in this series.
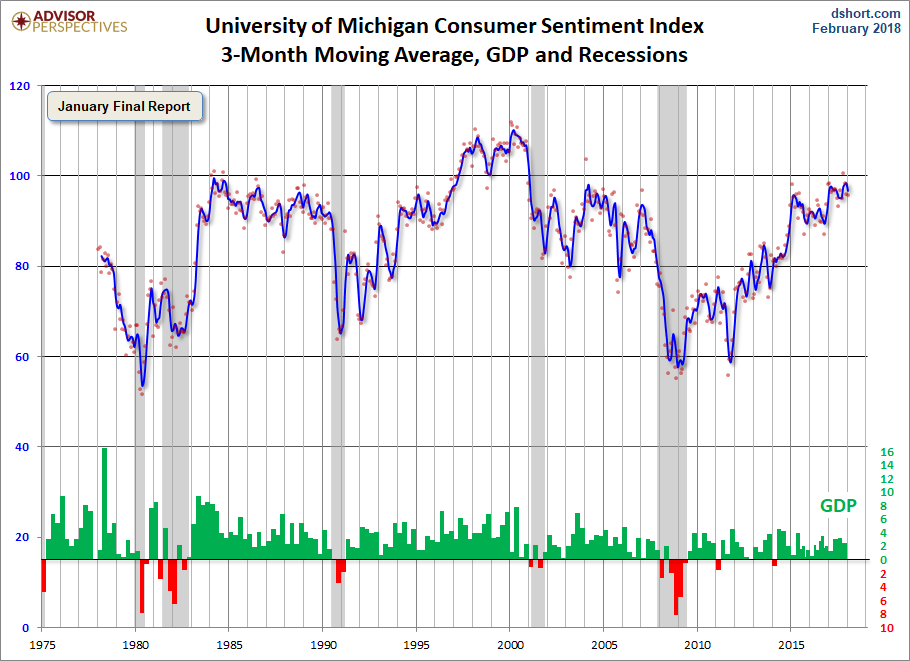
Note that this indicator is somewhat volatile, with a 3.0 point absolute average monthly change. The latest data point saw a 0.2 percent change from the previous month. For a visual sense of the volatility, here is a chart with the monthly data and a three-month moving average.
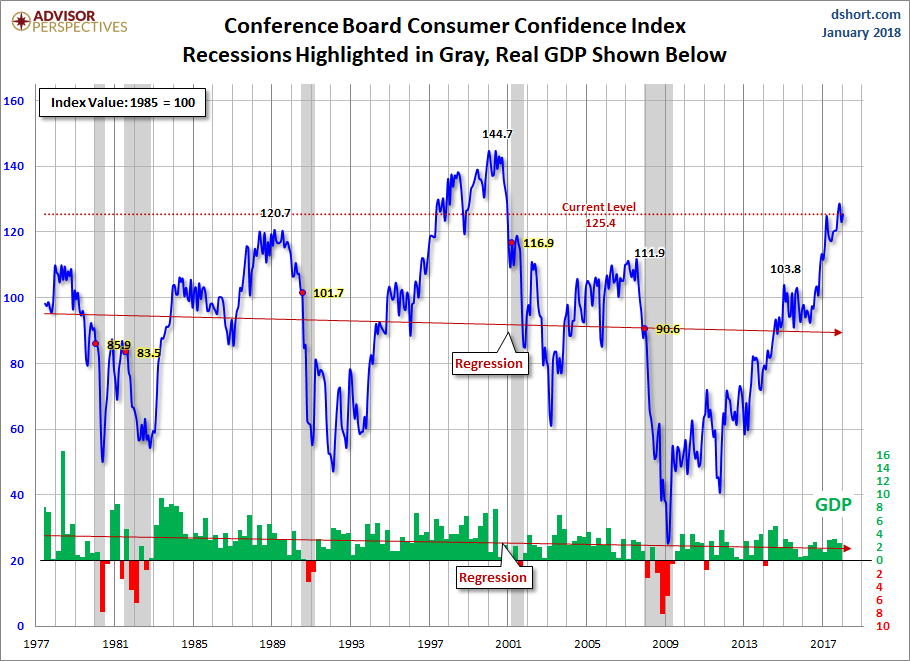
For the sake of comparison, here is a chart of the Conference Board’s Consumer Confidence Index (monthly update here). The Conference Board Index is the more volatile of the two, but the broad pattern and general trends have been remarkably similar to the Michigan Index.
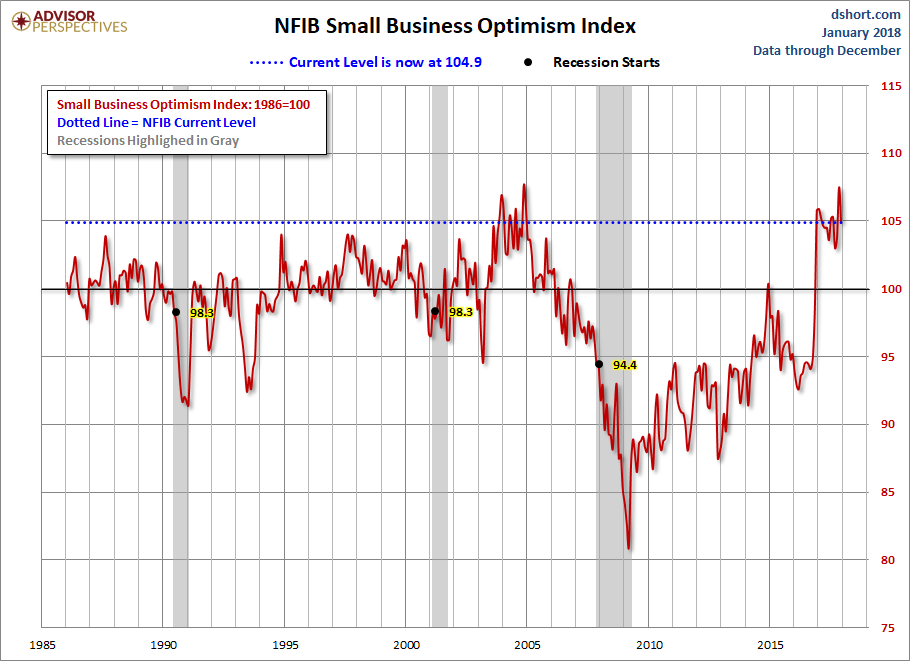
And finally, the prevailing mood of the Michigan survey is also similar to the mood of small business owners, as captured by the NFIB Business Optimism Index (monthly update here).
The general trend in the Michigan Sentiment Index since the Financial Crisis lows has been one of slow improvement.The survey findings since December 2015 saw gradual decline followed by a bounceback later in the year.
include(“/home/aleta/public_html/files/ad_openx.htm”); ?>


