by Doug Short / Jill Mislinski, Advisor Perspectives/dshort.com
The University of Michigan Final Consumer Sentiment for February came in at 96.3, down from the January Final reading of 98.5. Investing.com had forecast 96.0.

Surveys of Consumers chief economist, Richard Curtin makes the following comments:
While consumer confidence edged upward in late February, it remained slightly below the decade peak recorded in January. Overall, the Sentiment Index has been higher during the past three months than anytime since March 2004. Normally, the implication would be that consumers expected Trump’s election to have a positive economic impact. That is not the case since the gain represents the result of an unprecedented partisan divergence, with Democrats expecting recession and Republicans expecting robust growth. Indeed, the difference between these two parties is nearly identical to the difference between the all-time peak and trough values in the Expectations Index – 64.6 versus 64.4. While the expectations of Democrats and Republicans largely offset each other, the overall gain in the Expectations Index was due to self-identified Independents, who were much closer to the optimism of the Republicans than the pessimism of the Democrats. (Note: the February Expectations Index was 55.5 among Democrats, 120.1 among Republicans, and 89.2 among Independents.) Since neither recession nor robust growth is expected in 2017, both extremes must eventually converge. Although the data indicate a growth rate of 2.7% in consumption during 2017, the data also indicate we can expect greater volatility and discretionary spending differences across subgroups.
See the chart below for a long-term perspective on this widely watched indicator. Recessions and real GDP are included to help us evaluate the correlation between the Michigan Consumer Sentiment Index and the broader economy.
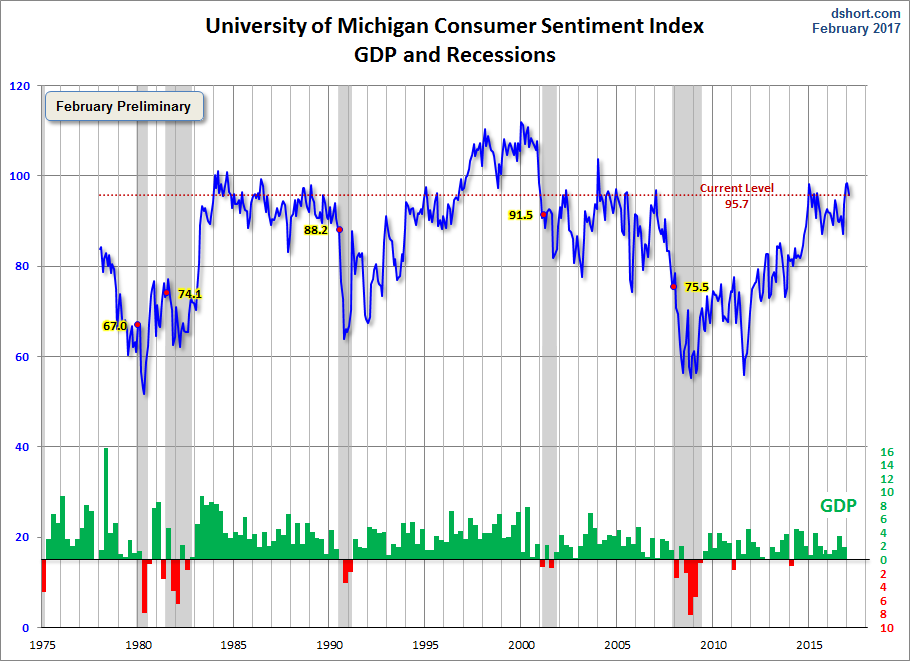
To put today’s report into the larger historical context since its beginning in 1978, consumer sentiment is 12.6 percent above the average reading (arithmetic mean) and 13.9 percent above the geometric mean. The current index level is at the 84th percentile of the 470 monthly data points in this series.
The Michigan average since its inception is 85.5. During non-recessionary years the average is 87.7. The average during the five recessions is 69.3. So the latest sentiment number puts us 27.0 points above the average recession mindset and 8.6 points below the non-recession average.
Note that this indicator is somewhat volatile, with a 3.0 point absolute average monthly change. The latest data point saw a 2.2 point change from the previous month. For a visual sense of the volatility, here is a chart with the monthly data and a three-month moving average.

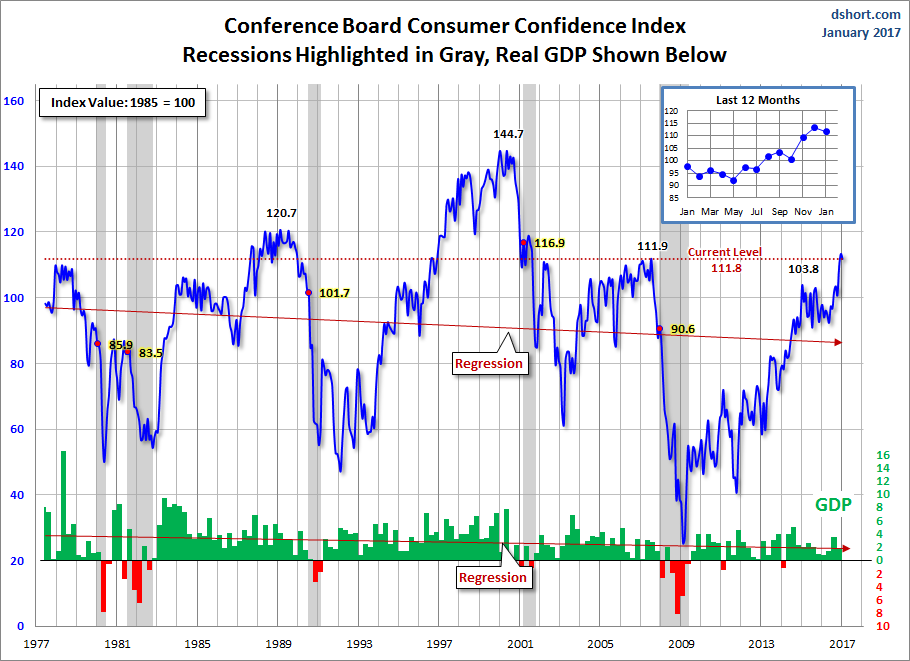
For the sake of comparison, here is a chart of the Conference Board’s Consumer Confidence Index (monthly update here). The Conference Board Index is the more volatile of the two, but the broad pattern and general trends have been remarkably similar to the Michigan Index.
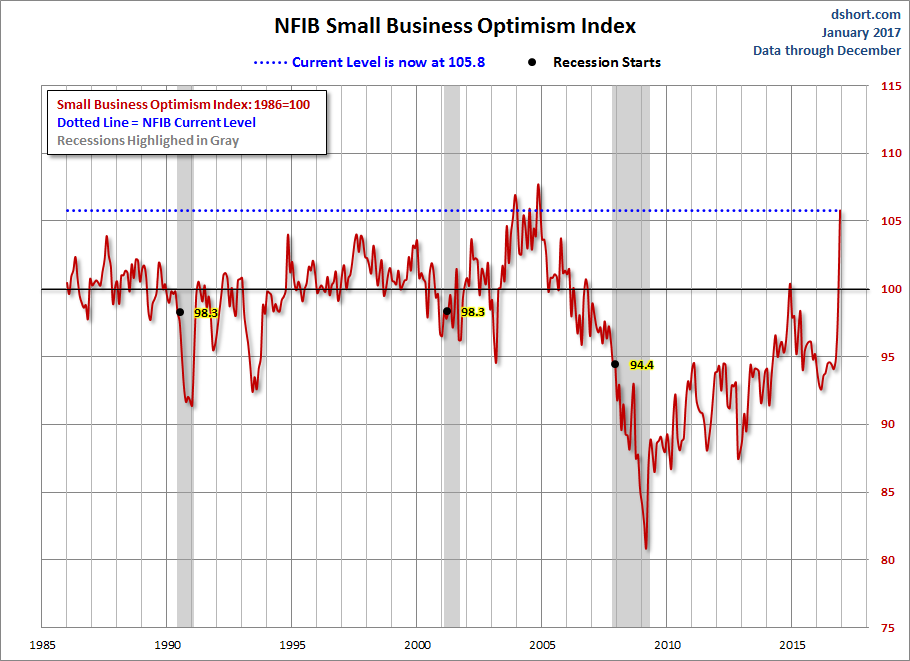
And finally, the prevailing mood of the Michigan survey is also similar to the mood of small business owners, as captured by the NFIB Business Optimism Index (monthly update here).
The general trend in the Michigan Sentiment Index since the Financial Crisis lows has been one of slow improvement.The survey findings since December 2015 saw gradual decline followed by a bounceback later in the year with its interim peak in January of 2017.
Caveats on the Use of University of Michigan Consumer Sentiment
This survey is quantitatively derived from a fairly complex questionnaire (sample here) via a monthly telephone survey. According to Bloomberg:
This release is frequently released early. It can come out as early as 9:55am EST. The official release time is 10:00. Base year 1966=100. A survey of consumer attitudes concerning both the present situation as well as expectations regarding economic conditions conducted by the University of Michigan. For the preliminary release approximately three hundred consumers are surveyed while five hundred are interviewed for the final figure. The level of consumer sentiment is related to the strength of consumer spending. Please note that this report is released twice per month. The first is a preliminary figure while the second is the final (revised) figure.
This is a survey, a quantification of opinion rather than facts and data. The question – does sentiment lead or truly correlate to any economic activity? Since 1990, there seems to be a loose general correlation to real household income growth.

include(“/home/aleta/public_html/files/ad_openx.htm”); ?>


