Written by Steven Hansen
The Producer Price Index year-over-year inflation remains at 1.6 %. This is a pause in the increasing inflation seen since the 2H2016.

Analyst Opinion of Producer Prices
Although there is little change in year-over-year final demand inflation, one should observe that it is goods driving inflation whilst services is moderating inflation. From the BLS:
Over half of the January increase in prices for final demand goods is attributable to the gasoline index, which advanced 12.9 percent. The indexes for pharmaceutical preparations, iron and steel scrap, home heating oil, residential natural gas, and pork also moved higher. In contrast, prices for beef and veal fell 7.2 percent. The indexes for light motor trucks and for candy and nuts also decreased.
Nearly half of the January increase in the index for final demand services can be attributed to margins for apparel, jewelry, footwear, and accessories retailing, which advanced 4.8 percent. The indexes for fuels and lubricants retailing, loan services (partial), airline passenger services, food and alcohol retailing, and services related to securities brokerage and dealing also moved higher. In contrast, prices for guestroom rental fell 3.3 percent. The indexes for apparel wholesaling and bundled wired telecommunications access services also decreased.
The PPI represents inflation pressure (or lack thereof) that migrates into consumer price.
- The BLS reported that the headline Producer Price Index (PPI) finished goods prices (now called final demand prices) year-over-year inflation rate remained unchanged at 1.6.
- The market had been expecting (from Bloomberg):
| month over month change | Consensus Range | Consensus | Actual |
| PPI-Final Demand (PPI-FD) | 0.2 % to 0.4 % | +0.3 % | +0.6% |
| PPI-FD less food & energy (core PPI) | 0.1 % to 0.2 % | +0.2 % | +0.2 % |
| PPI-FD less food, energy & trade services | 0.1 % to 0.3 % | +0.2 % | +0.2 % |
The producer price inflation breakdown:
| category | month-over-month change | year-over-year change |
| final demand goods | +1.0 % | |
| final demand services | +0.3 % | |
| total final demand | +0.6 % | +1.6 % |
| processed goods for intermediate demand | +1.1 % | +3.8 % |
| unprocessed goods for intermediate demand | +3.8 % | +17.8 % |
| services for intermediate demand | +0.3 % | +1.5 % |

z ppi1.png
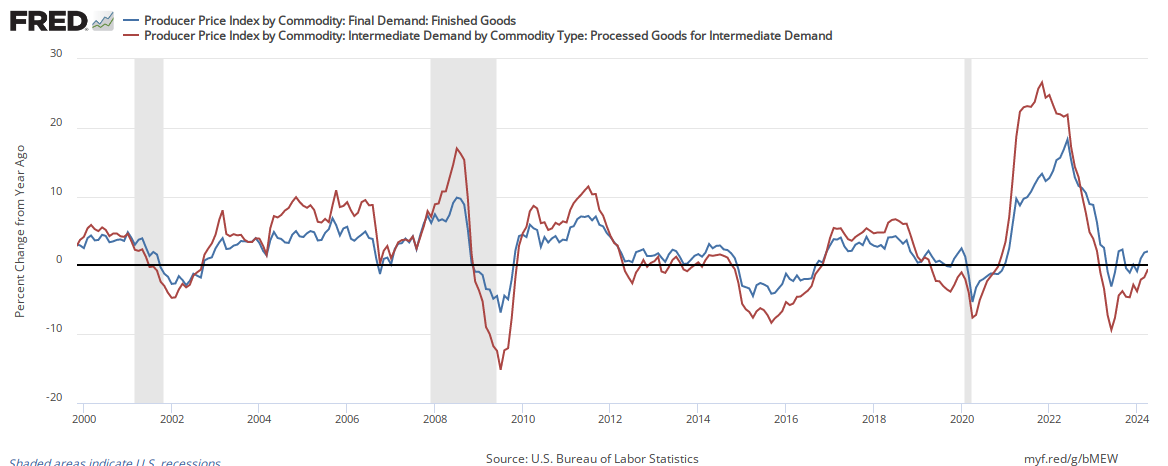
In the following graph, one can see the relationship between the year-over-year change in intermediate goods index and finished goods index. When the crude goods growth falls under finish goods – it usually drags finished goods lower.
Percent Change Year-over-Year – Comparing PPI Finished Goods (blue line) to PPI Intermediate Goods (red line)
Econintersect has shown how pricing change moves from the PPI to the Consumer Price Index (CPI). This YoY change implies that the CPI, should continue to come in around 2.0% YoY.
Comparing Year-over-Year Change Between the PPI Finished Goods Index (blue line) and the CPI-U (red line)

The price moderation of the PPI began in September 2011 when the year-over-year inflation was 7.0%.
Caveats on the Use of Producer Price Index
Econintersect has performed several tests on this series and finds it fairly representative of price changes (inflation). However, the headline rate is an average – and for an individual good or commodity, this series provides many sub-indices for specific application.
A very good primer on the Producer Price Index nuances can be found here.
Because of the nuances in determining the month-over-month index values, the year-over-year or annual change in the PPI index is preferred for comparisons.
There is moderate correlation between crude goods and finished goods. Higher crude material prices push the finished goods prices up.
include(“/home/aleta/public_html/files/ad_openx.htm”); ?>


