
Written by Steven Hansen
The headlines say construction spending was down, and again was significantly below expectations. This series remains in contraction after almost 5 years in expansion.

Analyst Opinion of Construction Spending
Public construction continues go deeper in contraction, whilst private construction is no in a down trend. Overall, however – construction is now contracting after spending nearly 5 years expanding year-over-year. Still note that the rolling averages did improve.
The backward revision for the previous months were upward. This was well below expectations. This is a headwind to 3Q2016 GDP – and remember the headline numbers are not inflation adjusted where inflation is currently running 0.8%.
But the confusion is that construction spending does not correlate to construction employment – casting doubt on the validity of one or both data sets.

Econintersect analysis:
- Growth deceleration 1.6 % month-over-month and down 0.6 % year-over-year.
- Inflation adjusted construction spending down 1.4 % year-over-year.
- 3 month rolling average is 1.0 % ABOVE the rolling average one year ago, and accelerated 0.3 % month-over-month. As the data is noisy (and has so much backward revision) – the moving averages likely are the best way to view construction spending.
- Backward revision for the last 3 months was up.
Unadjusted Construction Spending – Three Month Rolling Average Compared to the Rolling Average One Year Ago

z%20construction%20spending.png
- Down 0.4 % month-over-month and down 0.2 % year-over-year (versus the reported -0.3 % year-over-year growth last month).
- Market expected 0.2 % to 0.8 % month-over-month (consensus +0.6) versus the -0.4 % reported
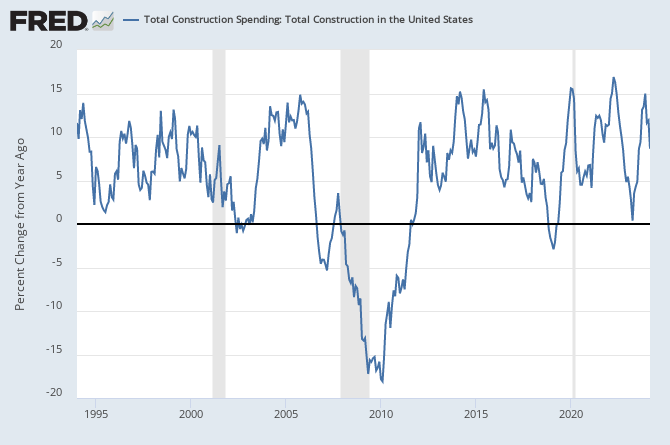
Construction spending (unadjusted data) was declining year-over-year for 48 straight months until November 2011. That was four years of headwinds for GDP. This month is the beginning of a new decline cycle.
Indexed and Seasonally Adjusted Total Construction Spending (blue line) and Inflation Adjusted (red line)

This month’s headline statement from US Census:
The U.S. Census Bureau of the Department of Commerce announced today that construction spending during September 2016 was estimated at a seasonally adjusted annual rate of $1,150.0 billion, 0.4 percent (±1.3%)* below the revised August estimate of $1,154.4 billion. The September figure is 0.2 percent (±1.8%)* below the September 2015 estimate of $1,152.1 billion. During the first 9 months of this year, construction spending amounted to $863.2 billion, 4.4 percent (±1.2%) above the $826.8 billion for the same period in 2015.
PRIVATE CONSTRUCTION – Spending on private construction was at a seasonally adjusted annual rate of $879.7 billion, 0.2 percent (±1.0%)* below the revised August estimate of $881.6 billion. Residential construction was at a seasonally adjusted annual rate of $453.7 billion in September, 0.5 percent (±1.3%)* above the revised August estimate of $451.3 billion. Nonresidential construction was at a seasonally adjusted annual rate of $426.0 billion in September, 1.0 percent (±1.0%)* below the revised August estimate of $430.2 billion.
PUBLIC CONSTRUCTION – In September, the estimated seasonally adjusted annual rate of public construction spending was $270.3 billion, 0.9 percent (±2.5%)* below the revised August estimate of $272.8 billion. Educational construction was at a seasonally adjusted annual rate of $66.6 billion, 1.1 percent (±4.1%)* below the revised August estimate of $67.4 billion. Highway construction was at a seasonally adjusted annual rate of $86.6 billion, 0.9 percent (±5.4%)* above the revised August estimate of $85.8 billion.
Unadjusted Total Construction Spending Year-Over-Year (blue line) and Month-over-Month (red line) Change

Unadjusted Total Construction Spending Year-Over-Year (blue line) Since 1993
Unadjusted Private Construction Spending Year-Over-Year (blue line) and Month-over-Month (red line) Change

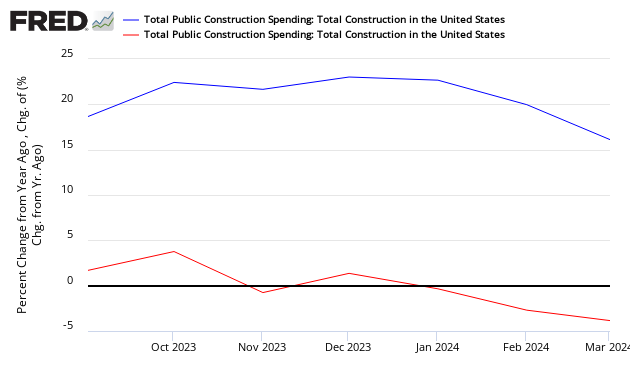
Unadjusted Public Construction Spending Year-Over-Year (blue line) and Month-over-Month (red line) Change
Private construction had been fueling construction growth.
Caveats on the Use of Construction Spending Data
Although the data in this series is revised for several months after issuing, the revision is generally minor. This series is produced by sampling – and the methodology varies by sector being sampled.
The headline data is seasonally adjusted. Econintersect uses the raw unadjusted data.Econintersect determines the month-over-month change by subtracting the current month’s year-over-year change from the previous month’s year-over-year change. This is the best of the bad options available to determine month-over-month trends – as the preferred methodology would be to use multi-year data (but the New Normal effects and the Great Recession distort historical data).
The data set for construction spending is not inflation adjusted. Econintersect adjusts using the BLS Producers Price Index – subindex New Construction (PCUBNEW-BNEW). However in the inflation adjusted graph in this post, FRED does not have this series – andEconintersect has used Producer Price Index: Finished Goods Less Energy (PPIFLE), Monthly, Seasonally Adjusted which has similar characteristics.
Construction (which historically is an major economic driver) is a literal shadow of its former self. Its contribution to GDP is down $400 billion from its peak level in 2006. The main driver of construction spending is the private sector. Here is the historical breakdown. The graph below uses US Census seasonally adjusted data.

Obvious from the above graph that public spending on construction is falling off, while private spending is slightly trending up. The overall effect is that construction spending is near the same place it was in early 2010.
include(“/home/aleta/public_html/files/ad_openx.htm”); ?>


