Written by Steven Hansen
 The ISM non-manufacturing (aka ISM Services) index continues its growth cycle, but declined insignificantly from 55.9 to 55.3 (above 50 signals expansion). Important internals improved, however, and remain in expansion. Market PMI Services Index was released this morning, also is in expansion, and also declined.
This was below expectations (from Bloomberg) of 55.5 to 57.0 (consensus 56.5).
For comparison, the Market PMI Services Index was released this morning also – and it weakened marginally. Here is the analysis from Bloomberg:
Released On 1/6/2016 9:45:00 AM For Dec, 2015
Prior Actual Level 56.1 54.3 Highlights
The services PMI slowed to 54.3 for the final December reading, well down from November’s 56.1 but up 6 tenths from the December flash of 53.7. Growth in new orders came in at its slowest rate since the weather disruptions in January last year with some respondents citing a “wait-and-see” approach among customers. Though output is slowing and backlogs are being worked down, the sample is still adding employees at a solid pace. Price data are soft with both input inflation and output charges continuing to moderate. Another negative is an easing in business expectations to their least optimistic level since July. But the hiring in this report is clearly a positive and hints at what may be Friday’s conflicting theme — strong job growth amid slowing activity.
There are two sub-indexes in the NMI which have good correlations to the economy – the Business Activity Index and the New Orders Index – both have good track records in spotting an incipient recession – both remaining in territories associated with expansion.
This index and its associated sub-indices are fairly volatile – and onande needs to step back from the data and view this index over longer periods than a single month.
The Business Activity sub-index declined 0.5 points and now is at 58.7.
ISM Services – Business Activity Sub-Index

The New Orders Index improved 0.7 and is currently at 58.2.
ISM Services – New Orders Sub-Index

The complete ISM manufacturing and non-manufacturing survey table is below.

Econintersect does give serious consideration to this survey as the service sector accounts for 80% of the economy and 90% of employment. However, this an opinion survey and is not hard data.
From the ISM report:
Economic activity in the non-manufacturing sector grew in December for the 71st consecutive month, say the nation’s purchasing and supply executives in the latest Non-Manufacturing ISM® Report On Business®.
The report was issued today by Anthony Nieves, CPSM, C.P.M., CFPM, chair of the Institute for Supply Management® (ISM®) Non-Manufacturing Business Survey Committee. “The NMI® registered 55.3 percent in December, 0.6 percentage point lower than the November reading of 55.9 percent. This represents continued growth in the non-manufacturing sector at a slightly slower rate. The Non-Manufacturing Business Activity Index increased to 58.7 percent, which is 0.5 percentage point higher than the November reading of 58.2 percent, reflecting growth for the 77th consecutive month at a slightly faster rate. The New Orders Index registered 58.2 percent, 0.7 percentage point higher than the reading of 57.5 percent in November. The Employment Index increased 0.7 percentage point to 55.7 percent from the November reading of 55 percent and indicates growth for the 22nd consecutive month. The Prices Index decreased 0.6 percentage point from the November reading of 50.3 percent to 49.7 percent, indicating prices decreased in December for the third time in the last four months. According to the NMI®, 11 non-manufacturing industries reported growth in December. Faster deliveries in December contributed to the overall slight slowing in the rate of growth according to the NMI® composite index. All of the other component indexes increased in the month of December. The majority of respondents’ comments remain positive about business conditions and the overall economy.”
INDUSTRY PERFORMANCE
The 11 non-manufacturing industries reporting growth in December — listed in order — are: Accommodation & Food Services; Management of Companies & Support Services; Health Care & Social Assistance; Information; Retail Trade; Real Estate, Rental & Leasing; Arts, Entertainment & Recreation; Finance & Insurance; Construction; Professional, Scientific & Technical Services; and Utilities. The five industries reporting contraction in December are: Other Services; Educational Services; Wholesale Trade; Public Administration; and Transportation & Warehousing.
Caveats on the use of ISM Non-Manufacturing Index:
This is a survey, a quantification of opinion. However, as pointed out above, certain elements of this survey have good to excellent correlation to the economy for as long as it has been in existence. Surveys lead hard data by weeks to months, and can provide early insight into changing conditions.
The main ISM non-manufacturing index (NMI) is so new that it does not have enough data history to have reliable certainty about how it correlates to the economy. Again, two sub-indices (business activity and new orders) do have good correlation for the limited history available.
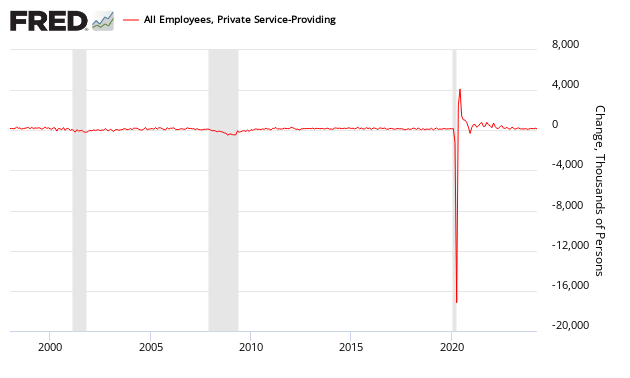
No survey is accurate in projecting employment – and the ISM Non-Manufacturing Employment Index is no exception. Although there are some general correlation in trends if you stand far enough back from this graph, month-to-month movements have not correlated well with the BLS Service Sector Employment data.
ISM Services Employment Sub-Index vs BLS Non-Farm Services Employment
include(“/home/aleta/public_html/files/ad_openx.htm”); ?>


