Global Economic Intersection
Advertisement
  • Home
  • Economics
  • Finance
  • Politics
  • Investments
    • Invest in Amazon $250
  • Cryptocurrency
    • Best Bitcoin Accounts
    • Bitcoin Robot
      • Quantum AI
      • Bitcoin Era
      • Bitcoin Aussie System
      • Bitcoin Profit
      • Bitcoin Code
      • eKrona Cryptocurrency
      • Bitcoin Up
      • Bitcoin Prime
      • Yuan Pay Group
      • Immediate Profit
      • BitQH
      • Bitcoin Loophole
      • Crypto Boom
      • Bitcoin Treasure
      • Bitcoin Lucro
      • Bitcoin System
      • Oil Profit
      • The News Spy
      • Bitcoin Buyer
      • Bitcoin Inform
      • Immediate Edge
      • Bitcoin Evolution
      • Cryptohopper
      • Ethereum Trader
      • BitQL
      • Quantum Code
      • Bitcoin Revolution
      • British Trade Platform
      • British Bitcoin Profit
    • Bitcoin Reddit
    • Celebrities
      • Dr. Chris Brown Bitcoin
      • Teeka Tiwari Bitcoin
      • Russell Brand Bitcoin
      • Holly Willoughby Bitcoin
No Result
View All Result
Global Economic Intersection
No Result
View All Result
Home Uncategorized

January 2015 Sea Container Count Contraction Damaging to the Economy

admin by admin
September 6, 2021
in Uncategorized
0
0
SHARES
5
VIEWS
Share on FacebookShare on Twitter

Written by Steven Hansen

Better late than never?? The Port of Los Angeles finally issued its January data (almost a half month late), and allowing analysis of the traffic in the Ports of Los Angeles and Long Beach. The labor dispute’s damage to the freight movements shows both exports and imports were down over 20% from one year ago. With $1 trillion dollars of movements through the West Coast Ports annually, this kind of strike will prove damaging to the economy.

As this labor dispute is apparently resolved, I suspect a majority of the the lost movements will be recovered in the coming months. The majority is not all:

  • some traffic went to other ports not affected by the dispute;
  • some perishables simply rotted;
  • some perishables were not shipped (and will never be shipped as they went elsewhere);
  • some items were sourced elsewhere.

It will be months until container movements can be used as a guage of the economy.

Consider that imports final sales are added to GDP usually several months after import – while the import cost itself is subtracted from GDP in the month of import. Export final sales occur around the date of export. Container counts do not include bulk commodities such as oil or autos which are not shipped in containers. For this month:

Acceleration Month-over-MonthChange from One Year AgoYear to Date vs. Previous Year3 Month Rolling Average vs. Average One Year AgoAcceleration 3 Month Rolling Average
Imports-26.0%-26.0%-26.0%-9.4%-10.7%
Exports-10.3%-21.8%-21.8%-15.9%-3.5%

As the data is very noisy – the best way to look at this data is the 3 month rolling averages. There is a direct linkage between imports and USA economic activity – and the change in growth in imports foretells real change in economic growth. Export growth is an indicator of competitiveness and global economic growth.

This deceleration of imports 3 month rolling average is not a positive sign for GDP as the year progresses.

Unadjusted 3 Month Rolling Average for Container Counts Year-over-Year Change (comparing the 3 month average one year ago to the current 3 month average) – Ports of Los Angeles and Long Beach Combined – Imports (red line) and Exports (blue line)

z container4.PNG

There is reasonable correlation between the container counts and the US Census trade data also being analyzed by Econintersect. But trade data lags several months after the more timely container counts.

Unadjusted Year-over-Year Change in Container Counts – Ports of Los Angeles and Long Beach Combined – Imports (red line) and Exports (blue bars)

z container1.PNG

Econintersect considers import and exports significant elements in determining economic health (please see caveats below). The takeaway from the graphs below is that neither imports or exports have returned to pre-2007 recession levels.

Unadjusted Import Container Counts – Ports of Los Angeles and Long Beach Combined

z container2.PNG

Unadjusted Export Container Counts – Ports of Los Angeles and Long Beach Combined

z container3.png

The Ports of LA and Long Beach account for much (approximately 40%) of the container movement into and out of the United States – and these two ports report their data significantly earlier than other USA ports. Most of the manufactured goods move between countries in sea containers (except larger rolling items such as automobiles). This pulse point is an early indicator of the health of the economy.

Containers come in many sizes so a uniform method involves expressing the volume of containers in TEU, the volume of a standard 20 foot long sea container. Thus a standard 40 foot container would be 2 TEU.

There is a good correlation between container counts and trade data (the US Census trade data is shown on the graph below). Using container counts gives a two month advance window on trade data.

Inflation Adjusted Year-over-Year Change Imports (blue line) and Exports (red line)
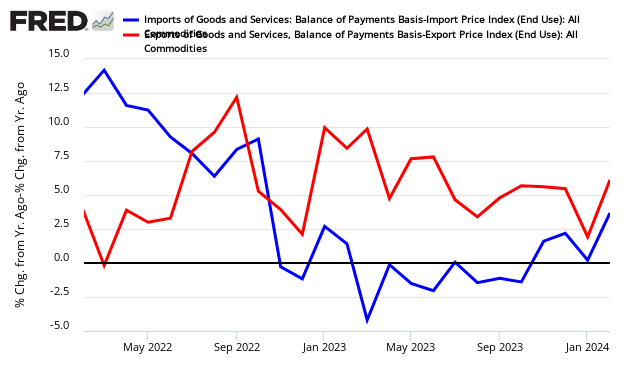
Transport growth in general has been trending down since mid-year.

Caveats on the Use of Container Counts

These are extraordinary times with historical data confused by a massive depression and significant monetary and fiscal intervention by government. Further containers are a relatively new technology and had a 14 year continuous growth streak from 1993 to 2006. There is not enough history to make any associations with economic growth – and we must assume a correlation exists.

Further, it is impossible from this data to understand commodity or goods breakdown (e.g. what is the contents in the containers). Any expansion or contraction cannot be analyzed to understand causation.

Imports are a particularly good tool to view the Main Street economy. Imports overreact to economic changes much like a double ETF making movements easy to see.

Contracting imports historically is a recession marker, as consumers and businesses start to hunker down. Main Street and Wall Street are not necessarily in phase and imports can reflect the direction for Main Street when Wall Street may be saying something different. During some recessions, consumers and businesses hunkered down before the Wall Street recession hit – and in the 2007 recession the contraction began 10 months into the recession.

Above graph with current data:

Imports of Goods and Services
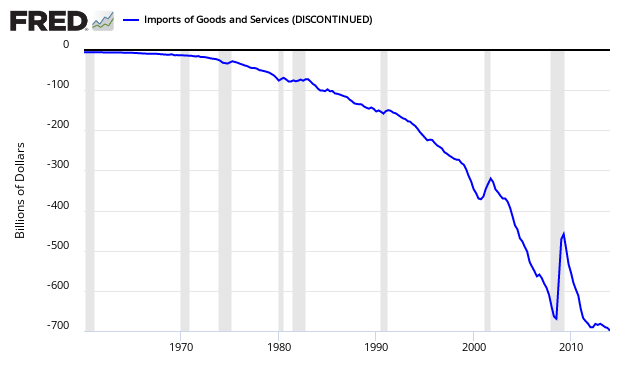
Econintersect determines the month-over-month change by subtracting the current month’s year-over-year change from the previous month’s year-over-year change. This is the best of the bad options available to determine month-over-month trends – as the preferred methodology would be to use multi-year data (but the New Normal effects and the Great Recession distort historical data).

Old Analysis Blog

New Analysis Blog

All Transport PostsAll Transport Posts
All Trade PostsAll Trade Posts

include(“/home/aleta/public_html/files/ad_openx.htm”); ?>

Permanent link to most recent post on this topic

Previous Post

Stratfor: A Look Back at the 1993 World Trade Center Bombing Investigation

Next Post

Wildfires Pose Big Risk To Nearly 900,000 Western US Homes In 2015. California, Colorado And Texas Contain The Most Homes At Risk.

Related Posts

Mexico's Pemex Dismantled Resources Worth $342M From Two Top Fields
Uncategorized

Mexico’s Pemex Dismantled Resources Worth $342M From Two Top Fields

by John Wanguba
January 20, 2023
Oil Giant Schlumberger Rebrands Itself As SLB For Low-Carbon Future
Uncategorized

Oil Giant Schlumberger Rebrands Itself As SLB For Low-Carbon Future

by John Wanguba
October 26, 2022
IOTA Is 600X More Energy Efficient Than Bitcoin With No Fees Helped By Tangle Tech
Uncategorized

IOTA Is 600X More Energy Efficient Than Bitcoin With No Fees Helped By Tangle Tech

by John Wanguba
October 3, 2022
Uncategorized

The Best Bitcoin Lottery UK 2022 – An Expert’s Pick!

by admin
February 17, 2022
Uncategorized

Founders Retire. GEI Transferred To New Owner

by admin
September 7, 2021
Next Post

Wildfires Pose Big Risk To Nearly 900,000 Western US Homes In 2015. California, Colorado And Texas Contain The Most Homes At Risk.

Leave a Reply Cancel reply

Your email address will not be published. Required fields are marked *

Browse by Category

  • Business
  • Econ Intersect News
  • Economics
  • Finance
  • Politics
  • Uncategorized

Browse by Tags

adoption altcoins banking banks Binance Bitcoin Bitcoin adoption Bitcoin market Bitcoin mining blockchain BTC business China crypto crypto adoption cryptocurrency crypto exchange crypto market crypto regulation decentralized finance DeFi Elon Musk ETH Ethereum Europe finance FTX inflation investment market analysis markets Metaverse mining NFT nonfungible tokens oil market price analysis recession regulation Russia technology Tesla the UK the US Twitter

Archives

  • January 2023
  • December 2022
  • November 2022
  • October 2022
  • September 2022
  • August 2022
  • July 2022
  • June 2022
  • May 2022
  • April 2022
  • March 2022
  • February 2022
  • January 2022
  • December 2021
  • November 2021
  • October 2021
  • September 2021
  • August 2021
  • July 2021
  • June 2021
  • May 2021
  • April 2021
  • March 2021
  • February 2021
  • January 2021
  • December 2020
  • November 2020
  • October 2020
  • September 2020
  • August 2020
  • July 2020
  • June 2020
  • May 2020
  • April 2020
  • March 2020
  • February 2020
  • January 2020
  • December 2019
  • November 2019
  • October 2019
  • September 2019
  • August 2019
  • July 2019
  • June 2019
  • May 2019
  • April 2019
  • March 2019
  • February 2019
  • January 2019
  • December 2018
  • November 2018
  • October 2018
  • September 2018
  • August 2018
  • July 2018
  • June 2018
  • May 2018
  • April 2018
  • March 2018
  • February 2018
  • January 2018
  • December 2017
  • November 2017
  • October 2017
  • September 2017
  • August 2017
  • July 2017
  • June 2017
  • May 2017
  • April 2017
  • March 2017
  • February 2017
  • January 2017
  • December 2016
  • November 2016
  • October 2016
  • September 2016
  • August 2016
  • July 2016
  • June 2016
  • May 2016
  • April 2016
  • March 2016
  • February 2016
  • January 2016
  • December 2015
  • November 2015
  • October 2015
  • September 2015
  • August 2015
  • July 2015
  • June 2015
  • May 2015
  • April 2015
  • March 2015
  • February 2015
  • January 2015
  • December 2014
  • November 2014
  • October 2014
  • September 2014
  • August 2014
  • July 2014
  • June 2014
  • May 2014
  • April 2014
  • March 2014
  • February 2014
  • January 2014
  • December 2013
  • November 2013
  • October 2013
  • September 2013
  • August 2013
  • July 2013
  • June 2013
  • May 2013
  • April 2013
  • March 2013
  • February 2013
  • January 2013
  • December 2012
  • November 2012
  • October 2012
  • September 2012
  • August 2012
  • July 2012
  • June 2012
  • May 2012
  • April 2012
  • March 2012
  • February 2012
  • January 2012
  • December 2011
  • November 2011
  • October 2011
  • September 2011
  • August 2011
  • July 2011
  • June 2011
  • May 2011
  • April 2011
  • March 2011
  • February 2011
  • January 2011
  • December 2010
  • August 2010
  • August 2009

Categories

  • Business
  • Econ Intersect News
  • Economics
  • Finance
  • Politics
  • Uncategorized
Global Economic Intersection

After nearly 11 years of 24/7/365 operation, Global Economic Intersection co-founders Steven Hansen and John Lounsbury are retiring. The new owner, a global media company in London, is in the process of completing the set-up of Global Economic Intersection files in their system and publishing platform. The official website ownership transfer took place on 24 August.

Categories

  • Business
  • Econ Intersect News
  • Economics
  • Finance
  • Politics
  • Uncategorized

Recent Posts

  • Philippines To Offer Value-Added Tax Refund To Foreign Visitors By 2024
  • Bitcoin Mining Revenue Rises 50% To $23M In A Month
  • U.S. Inflation Roller Coaster Sparks New Outlook On Long-Ignored Money Supply

© Copyright 2021 EconIntersect - Economic news, analysis and opinion.

No Result
View All Result
  • Home
  • Contact Us
  • Bitcoin Robot
    • Bitcoin Profit
    • Bitcoin Code
    • Quantum AI
    • eKrona Cryptocurrency
    • Bitcoin Up
    • Bitcoin Prime
    • Yuan Pay Group
    • Immediate Profit
    • BitIQ
    • Bitcoin Loophole
    • Crypto Boom
    • Bitcoin Era
    • Bitcoin Treasure
    • Bitcoin Lucro
    • Bitcoin System
    • Oil Profit
    • The News Spy
    • British Bitcoin Profit
    • Bitcoin Trader
  • Bitcoin Reddit

© Copyright 2021 EconIntersect - Economic news, analysis and opinion.

en English
ar Arabicbg Bulgarianda Danishnl Dutchen Englishfi Finnishfr Frenchde Germanel Greekit Italianja Japaneselv Latvianno Norwegianpl Polishpt Portuguesero Romanianes Spanishsv Swedish