Written by Lance Roberts, Clarity Financial
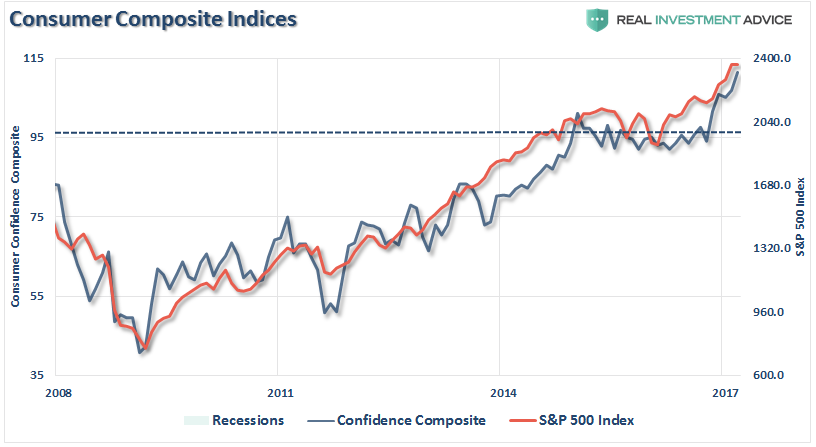
Since the election, consumer confidence has surged to historically high levels as shown in the chart below which is a composite of both Conference Board and University Of Michigan consumer confidence levels. Not surprisingly, stock prices track the trend of consumer confidence historically.

Please share this article – Go to very top of page, right hand side for social media buttons.
Also, not surprisingly, investor confidence has also surged just as sharply since the election along with the rise in asset prices. Over the last couple of decades, the International Center for Finance at Yale University has regularly surveyed both individual and institutional investors and asked them about their views of the market. As you can see, investors have gotten extremely bullish about potential future “positive” returns from the market over the next year, whereas just one year ago not so much.
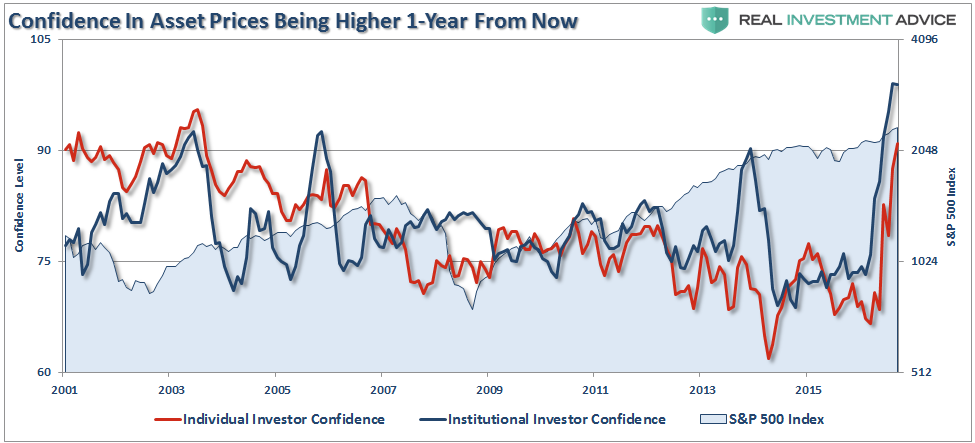
I have combined both the individual and institutional surveys into a composite index for a little better clarity.

Interestingly, despite the surge in confidence, the economy has failed to pick up traction. While the general consensus has been the “hard” economic data will surge to catch up with “booming” confidence, such is yet to be the case. Such was the message delivered Friday in the Q1-Gross Domestic Product report which showed an initial estimate of just 0.7% growth. The biggest issue with the report was the sharp slide in Personal Consumption Expenditures which comprises roughly 70% of overall economic growth which fell to just 0.23% on an annualized basis.
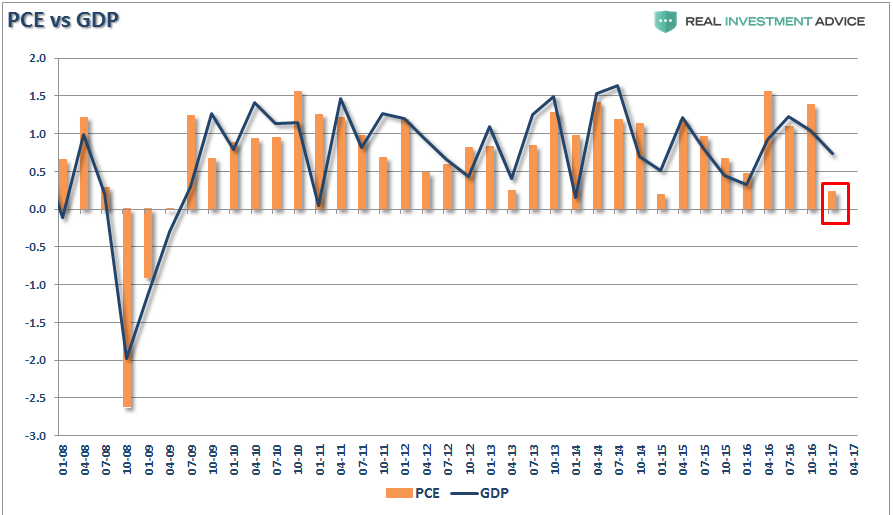
In other words, while consumers are extremely ebullient in their “hopes,” they are not acting that way.
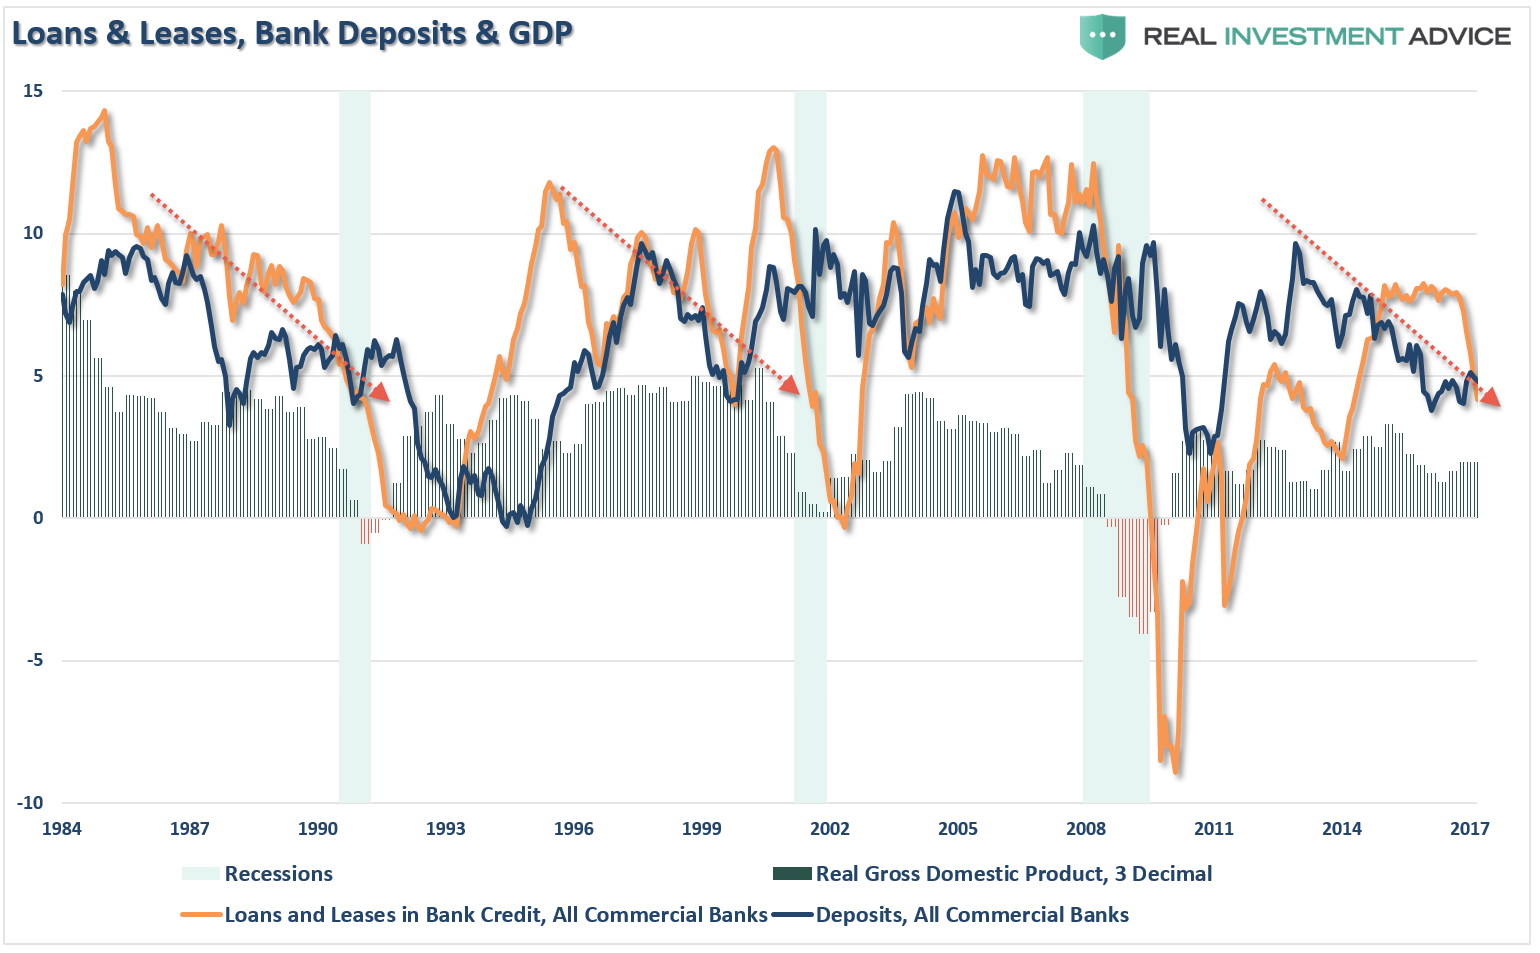
You will notice, however, while the weakness in the Q1 PCE was apparent, it is also not an anomaly. We have seen these slides in the past which usually pick up in Q2 as the businesses begin a “restocking cycle” for the summer. The difference this time, unlike the last, is the marked rise in consumer credit delinquency rates, decline in auto sales and decreases in lending activity.


Here is the point. While there is much “hope” that “Trumponomics” will create the economic lift needed to spur further economic growth, it is critically important to remember economic cycles DO have a life span to them. While monetary and fiscal policies do impact these cycles, one must also consider the point within the current cycle when those policies are implemented.
Lastly, and most importantly, as I wrote previously is “Records Are Records For A Reason,:”
“Record levels” of anything are records for a reason. It is where the point where previous limits were reached. Therefore, when a ‘record level’ is reached, it is NOT THE BEGINNING, but rather an indication of the MATURITY of a cycle. While the media has focused on employment, record stock market levels, etc. as a sign of an ongoing economic recovery, history suggests caution.”
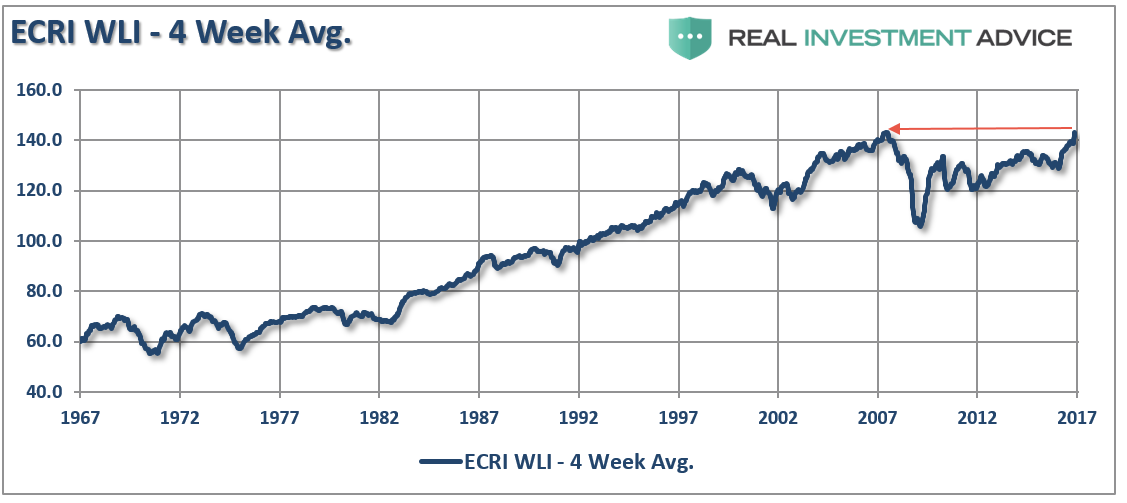
At the end of last year, based on the “hopes” of the new Administration policies, the Economic Cycle Research Institute’s (ECRI) Weekly Leading Index (WLI) spiked to a peak not seen since 2007.
It was a record.
This was important because there is a historically close correlation between the ECRI WLI and GDP as shown in the chart below. I have also included the Chicago Fed National Activity Index (CFNAI) which is a very broad measure of economic activity consisting of roughly 85 subcomponents.
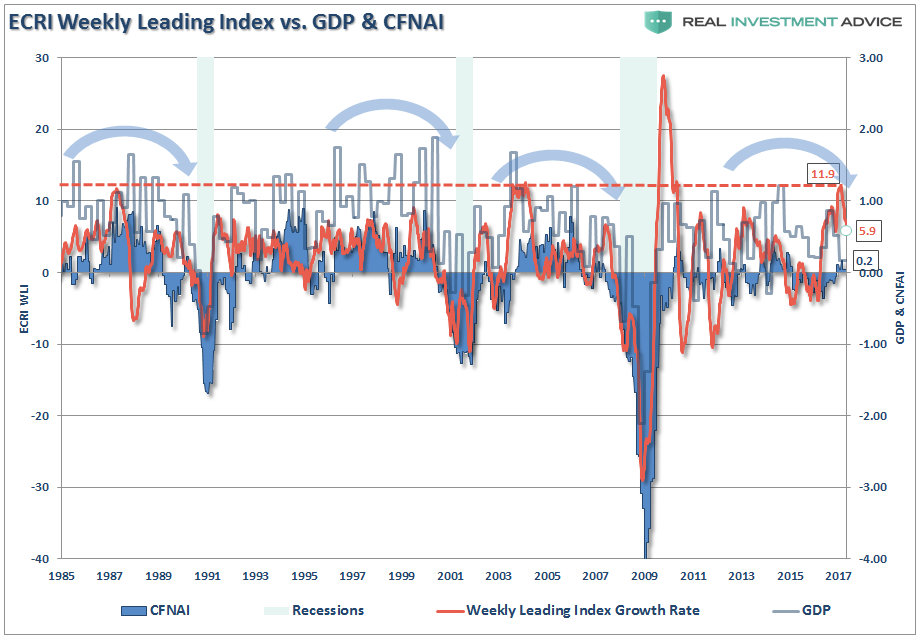
There have only been 3-other periods since 1985 where the WLI achieve levels as witnessed at the end of 2017. The difference, however, was that GDP and the CFNAI were growing at substantially stronger rates than currently seen. As I wrote at the end of December when the WLI was at 11.9:
“The significant divergence between the WLI and CFNAI measures are concerning as such divergences have tended to correct themselves over the next several months with the WLI correcting back towards the CFNAI.”
As expected then, the WLI has now fallen to just 5.9 as of the last update along with the decline in GDP and weakness in the CFNAI. Importantly, notice the overall TREND of the economic data is weaker, versus stronger, which has also been a hallmark of a “late stage” economic cycle.
The importance to investors is that recessionary spats in the economy lead to rather sharp price reversions as future growth expectations are ratcheted lower. Historically, the average “mean reverting” event has been roughly 30%.
While I am not suggesting a “recession” is about to start tomorrow, I am stating that “recessions are a fact of every economic cycle.”
For every economic recovery there is a recession and for every “bull market” there is a “bear market.”
These are the fact of life. While “timing” is always key, “ignoring” the fundamental factors has repeatedly proved dangerous to investors over time.
As I noted last week – “This Time Is Not Different.”
Hoping it will be has been costly in the past.
As investors “our goal” is to make money during the first half of the full market cycle, however, “our job” is to ensure that we keep it during the second half.
With investors now the most “exuberant” about the stock market since the turn of the century, it is worth reviewing what happened the last time that such a record was set.
Records are records for a reason.


