Written by Warren Mosler
New Home Sales, Services PMI, Mortgage Purchase Apps and Treasury Yield
New home sales came out yesterday. (See GEI for details.) It is challenging to put a good spin on this one as the wheels are coming off at every turn – but the Econoday folks gave it their best shot.

The two lengthy excerpts below are from Econoday, Economic Events and Analysis.
New Home Sales
New Home Sales
Highlights
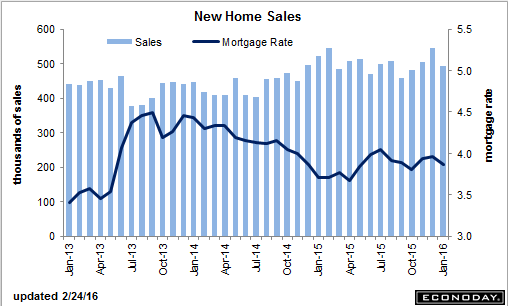
A downturn out West helped pull new homes sales down a steep 9.2 percent in January to a lower-than-expected annualized rate of 494,000. The level, however, is still respectable given that there is no revision to December which stands at a very solid 544,000. Sales in the West, which is a key region for the new home market, fell 32 percent in the month which pulls down the region’s year-on-year rate to minus 24 percent. The South and Midwest show only marginal year-on-year contraction with the Northeast, the smallest new home region however, up sharply.
Price discounting seems to be at play as it was in yesterday’s existing home sales report.The median price fell 5.7 percent in the month to $278,000 for a year-on-year decline of 4.5 percent. Sales had been ahead of prices before this report but not anymore, with a nearly double-digit year-on-year pace now falling into contraction at minus 5.2 percent.
Supply has been very slow to enter the market, the result largely of constraints in the construction sector. But more new homes did enter the market in the month, up 2.1 percent to 238,000 and supply relative to sales, given the slowdown in sales, is up sharply, to 5.8 months vs 5.1 months.
The slope for the housing sector has been volatile but is trending upward. Price discounts will help boost sales but will also pull down home-price appreciation which has been a central area of strength for household wealth.

U.S. Service Sector Purchasing Managers’ Index
The Purchasing Managers’ data is from a not so reliable survey organization that tends to overstate things. And it now has the service sector in contraction and the spin is bad as well:
PMI Services Flash
Highlights
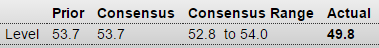
In what could be a chilling indication of trouble ahead, the February flash for the service PMI slipped below breakeven 50 to 49.8 for the weakest reading since the government shutdown of October 2013.
New orders are still growing but at the slowest pace in nearly six years with contraction in backlog orders the most severe since early 2014. The 12-month outlook, though still positive, is the least positive in 5-1/2 years. Employment in the sample is still growing but for how long is a question. Price data are not favorable, with inputs down and growth in selling prices at a 5-month low.
The breakdown in the service sector, a breakdown however still isolated to this report, would leave the economy without a central point of strength. The declines here do suggest that domestic demand could be on the downswing and falling in line with sinking demand overseas.
The following graph from Trading Economics shows just how sharply the U.S. service sector has “dried up” over the last three quarters.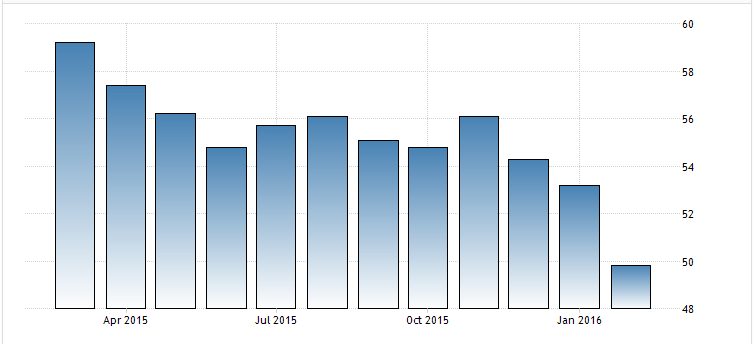
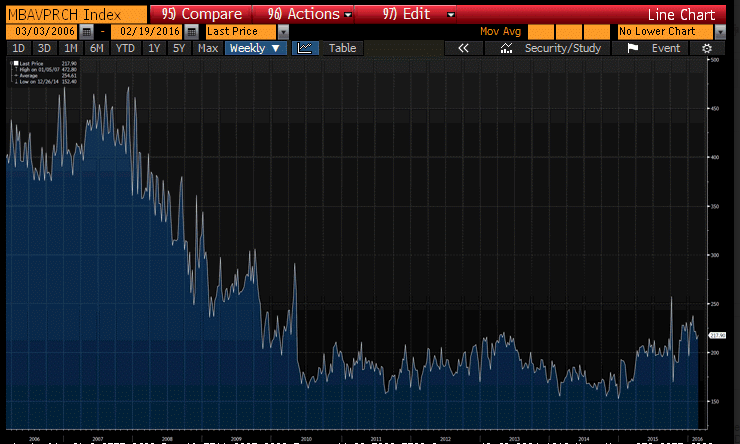
Mortgage Applications (New Purchases)
New purchase mortgage apps are up a bit this week but still depressed historically and the comps vs. a year ago will soon get a lot tougher. Chart from Bloomberg:
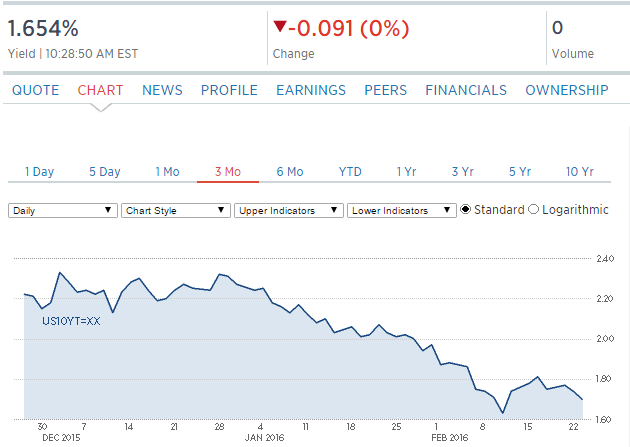
U.S. Treasury Market
From the way the yield has been falling on the 10 year treasury, it seems market participants don’t see the same economic strength the Fed sees (CNBC graphic):
Can anyone recommend a good wheelwright?


