by Peter Krauth, Money Morning
Article of the Week from Money Morning
It bears repeating: The gold bull market is back!
I admit that’s a big statement, and I believe the implications for every single investor are profound.
It will mean much, much higher gold prices, of course – a historic bull run that no investor will want to miss.

Please share this article – Go to very top of page, right hand side, for social media buttons.
How high is gold likely to go? I think we’ll see $1,400 this year and, eventually, $5,000 before this bull run is over.
Let me show you why I’m putting these targets out there for everyone…
Three Gold Indicators Point in One Direction: Straight Up
Some important technicals tell me higher prices are in the cards: price action, the Dow/gold ratio, and the Gold Miners Bullish Percent Index.
Let’s look at them one by one to understand just what they are telling us about gold’s future direction, and what we need to look for going forward.
Chart price action tends to be an influential technical indicator of the health of an asset or security, gold among them.
So a closer look at a long-term chart of the gold price helps us appreciate just where gold stands in the big picture, and how it’s been behaving lately.
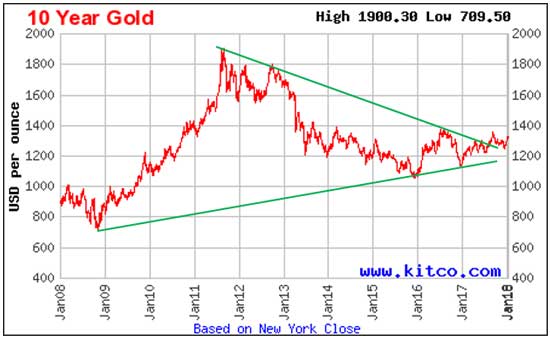
In September, gold broke out to the upside of a wedge it’s been forming since late 2008. And despite its temporary pullback below the psychologically important $1,300 level, gold has remained above the top of its wedge formation.
Looking at a five-year chart, we see that gold has bumped up against the $1,300 level multiple times, as that has acted as overhead resistance.
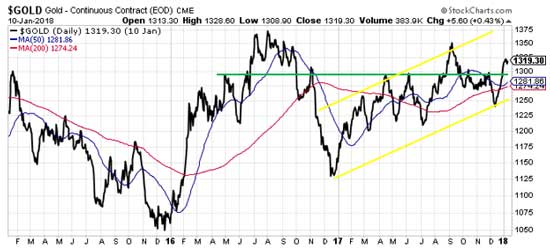
Gold has once again pushed above $1,300. This is the third time since gold returned to bull market action in December 2015. And this time it’s within a bullish rising channel, with the 50-day and 200-day moving averages both sloping upward.
Overall, the precious metal’s price action has been very positive, especially since the $1,050 bottom of two years ago, followed by a higher low one year ago.
What’s more, we’ve just completed two consecutive calendar years of positive returns.
My other charts look very strong, too…
Here’s What the Dow/Gold Ratio Shows
This ratio pits the Dow Jones Industrial Average against the price of gold, telling us how many ounces of the precious metal are needed to “buy the Dow” at a given point in time.
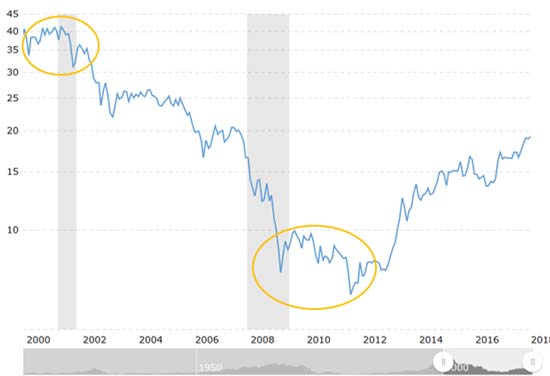
As we can see, the Dow’s peak in 2000 coincided with gold’s low, launching the multi-year bull market. During the 2008-2009 financial crisis, gold soared as the Dow crashed, leaving gold relatively expensive as the Dow eventually began a new multi-year bull.
What we need to look for now is a new peak, where the Dow once again establishes a high against the gold price. Over the last two years, both the Dow and gold have been rising, but the Dow’s been doing so at a faster pace.
Looking back on a 100-year chart, we see that we are already nearing lofty peaks in the 18 to 28 range, which has previously marked turning points.
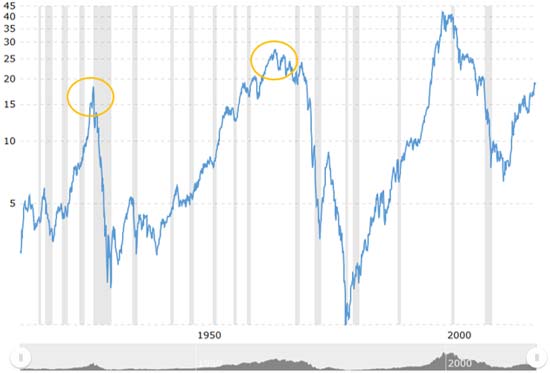
The first of these was in 1929, and then again in 1966. Consider that we are now well within that range.
I expect the Dow/gold ratio will peak again sometime within the next 12 to 24 months. That will be additional confirmation that gold is in bull market mode.
Here’s the final piece of the puzzle…
The Gold Miners Bullish Percent Index Looks Very Good
Now, the Gold Miners BPI does not refer to gold specifically, but instead to gold stocks. It’s true that gold stocks are a derivative of gold, but the fact is that they rise and fall along with their underlying commodity.
What is interesting is that gold stocks sometimes lead the price of gold higher.
Before gold finally returned to bull mode, you can see gold stocks in late 2015 attempting a breakout.
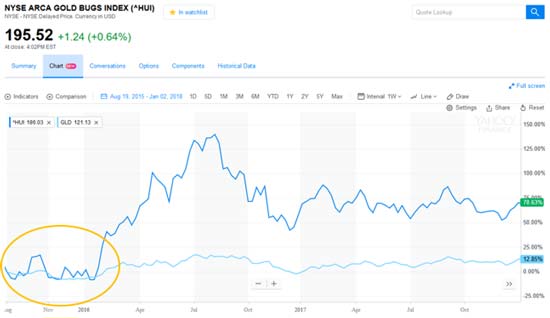
Once gold did start higher, gold stocks dramatically outperformed the metal.
Now, let’s fast-forward to today and look at the Gold Miners Bullish Percent Index (BPI). This tool measures overbought and oversold conditions for gold mining stocks.
When the index reaches above 80, it means 80% of the stocks in the sector are in a technical bull mode. However, that’s when they are most at risk of correction, as traders have become too bullish; gold stocks are overbought.
Conversely, when the BPI drops below 30, it has become oversold (with less than 30% of the sector trading in bull mode). Once it turns higher from that level, the BPI produces a buy signal that gold stocks could be starting a new rally.
Well… look at what happened in the second half of December.
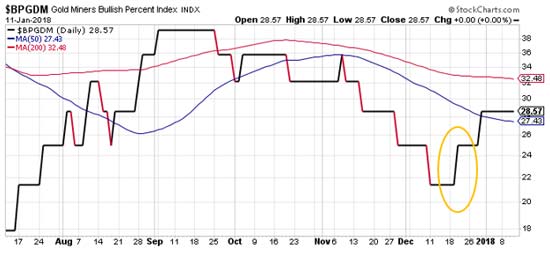
That’s when the BPI turned higher, took a short pause, then jumped higher again just before year’s end.
That signals gold stocks are in a new rally and could well pull gold prices higher along with them. Since then, gold stocks are up more than four times the gains in gold.
Such outperformance suggests the entire sector is not only in a bull market, but a very strong one, headed dramatically higher.
The strength of these three technical indicators is all the proof I need to tell me the gold bull market is back. This is your cue to make sure you don’t get left behind.


