Written by Gary
The markets and commodities are at a crossroad and need to be watched carefully. Oil is trading sideways near its resistance at high 39’s refusing to go higher, the U.S. dollar has rejected falling below its support, low 93’s, and is moving sharply upwards. Markets are trading sideways and short term indicators are very bullish for this session, but look like just a transition before reversing.

Here is the current market situation from CNN Money | |
 | North and South American markets are mixed. The S&P 500 is higher by 2.17%, while the IPC is leading the Bovespa lower. They are down 1.69% and 0.84% respectively. |
The large and small caps remain solidly below the 200 DMA and the BTFDers jumped in yesterday, but remain strangely elusive today as savvy investors sit on their collective hands determined to wait this one out. This session is looking more and more like a ‘relief’ pause for a trending bear correction that is still not defined, but at least one more test of current lows is expected.
Traders Corner – Health of the Market
| Index | Description | Current Value |
| Investors.com Members Sentiment: | % Bullish (the balance is Bearish) | 50% |
| CNN’s Fear & Greed Index | Above 50 = greed, below 50 = fear | 6% |
| Investors Intelligence sets the breath | Above 50 bullish | 23.6% |
| StockChart.com Overbought / Oversold Index ($NYMO) | anything below -30 / -40 is a concern of going deeper. Oversold conditions on the NYSE McClellan Oscillator usually bounce back at anything over -50 and reverse after reaching +40 oversold. | -104.27 |
| StockChart.com NYSE % of stocks above 200 DMA Index ($NYA200R) | $NYA200R chart below is the percentage of stocks above the 200 DMA and is always a good statistic to follow. It can depict a trend of declining equities which is always troubling, especially when it drops below 60% – 55%. Dropping below 40%-35% signals serious continuing weakness and falling averages. | 16.65% |
| StockChart.com NYSE Bullish Percent Index ($BPNYA) | Next stop down is ~57, then ~44, below that is where we will most likely see the markets crash. | 29.89% |
| StockChart.com S&P 500 Bullish Percent Index ($BPSPX) | In support zone and rising. ~62, ~57, ~45 at which the markets are in a full-blown correction. | 22.80% |
| StockChart.com 10 Year Treasury Note Yield Index ($TNX) | ten year note index value | 21.14 |
| StockChart.com Consumer Discretionary ETF (XLY) | As long as the consumer discretionary holds above [66.88], all things being equal, it is a good sign for stocks and the U.S. economy | 73.53 |
| StockChart.com NYSE Composite (Liquidity) Index ($NYA) | Markets move inverse to institutional selling and this NYA Index is followed by Institutional Investors | 9,995 |

What Is Moving the Markets
| Here are the headlines moving the markets. | |
| BTFD?Submitted by Jim Quinn via The Burning Platform blog, The CNBC bubble headed bimbos and brainless stock touting twits will be in ecstasy today as the ever predictable rebound is under way. The market will soar by over 500 points at the opening as the excuse of the day is China’s desperate interest rate cut to try and stem their downward spiraling economy and markets. The Wall Street captured boob tube brigade will tell their almost non-existent viewership that all is well. The terrifying plunge is in the past. The economy is great. Housing is strong. Stocks are now a bargain. It’s the best time to buy. Now for some factoids. Six of the ten largest point gains in the history of the stock market occurred between September 2008 and March 2009. That’s right.
During one of the greatest market collapses in history, the market soared by 5% to 11% in one day, six times. Here are the data points: 2008-10-13: +936.42 2008-10-28: +889.35 2008-11-13: +552.59 2009-03-23: +497.48 2008-11-21: +494.13 2008-09-30: +485.21 Do you think these factoids will be shared with the public today on the stock bubble networks? Not a chance. The mindset of the arrogant clueless investor is that by the end of today they will have recovered over 50% of their losses incurred in the last week. Even if they t … |
| Europe blue-chip shares on the cheap? Think again LONDON (Reuters) – Stock markets are rebounding after a bruising 48-hour sell-off. But with China still battling to revive its slowing economy, Europe’s “screaming buys” come with risks. |
| Wall St. posts biggest rally of the year (Reuters) – U.S. stocks posted their sharpest rally of the year on Tuesday, as investors sought out bargains a day after Wall Street’s worst performance in four years on fears China’s economy was slowing. |
| New home sales rise; consumer confidence at seven-month high WASHINGTON (Reuters) – New U.S. single-family home sales rebounded in July and consumer confidence increased to a seven-month high in August, pointing to underlying strength in the economy that could still allow the Federal Reserve to raise interest rates this year. |
| CBO says U.S. revenue gains push down deficit, delay default WASHINGTON (Reuters) – The U.S. budget deficit is likely to fall by $60 billion in 2015 due to strong revenue gains, the Congressional Budget Office said on Tuesday, enabling the government to stave off default without a debt limit hike perhaps through early December. |
| China Eases but Stench of Crisis RemainsChina’s double-barreled easing shot also came with a serving of market reform. |
| Hedge Fund Hotel California: Smart Money Darlings Crash Up To 42% In One WeekLate last week, we reported that as of mid-August hedge funds are set to record their seventh consecutive years of market underperformance (unless the S&P crashes into year end, the Fed does not lose control, and hedge funds actually end up being “hedged”).
Perhaps the main reason for this has been that over the past several years hedge funds have largely lost their stock-picker creativity (after all in a centrally-planned world the best returns come from levered beta, not targeted alpha) and courtesy of non-stop idea dinners (extensively swept for bugs beforehand) have made the same handful of stocks their top holdings. We presented the 50 most popular hedge fund stocks last week:
And while this “hedge fund” hotel strategy works on the way up, when everyone makes roughly the same profits, it is on the way down when these hedge fund hotels become “Hotel California” – hedge funds can check out, and sometimes they can even leave… with massive losses. According to a |
| Bridgewater’s Dalio: Next big Fed move will be to ease, not tighten NEW YORK (Reuters) – Ray Dalio, the founder of Bridgewater Associates, the world’s largest hedge fund, said the firm believes the next big move by the U.S. Federal Reserve will be to loosen monetary policy, not tighten it. |
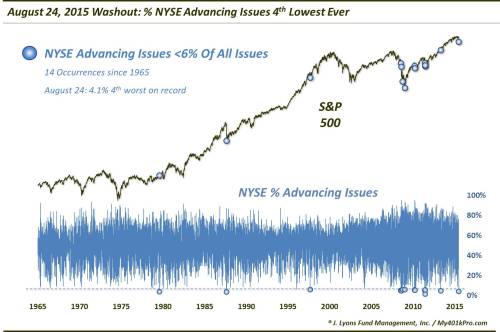
| August 24 – A True Market Washout?Via Dana Lyons’ Tumblr, It doesn’t happen too often, but occasionally we witness a true stock market “washout”. That is, a selloff marked by extremely one-sided (to the downside) trading action. Such days are exhibited by market participants that just want out at any price. The result is a day in which all market statistics are overwhelming skewed negatively. Such was the case yesterday, August 24. Here are but a few examples from the New York Stock Exchange:
Yesterday saw the 4th lowest % of NYSE Advancing Issues – 4.1% – since 1965. Each of the other 13 occurrences with less than 6% Advancing Issues saw the market form at least a short-term bottom within a day – except for one: the fall of 2008. That selloff, while not much longer in duration, did suffer extensive damage in subsequent days.
Yesterday saw just 2.38% of the volume on the NYSE go into Advancing Issues. Since 1965, there have been just 20 days with less than 6% Advancing Volume. Again, the market bottomed almost instantly (if temporarily, at times) following most such readings.
New 52-Week Lows Minus New Highs accounted for 40% of all issues on the NYSE. Readings that high have only occurred 15 t … |
| August 2015 Conference Board Consumer Confidence Rebounds Following Last Month’s Surprise Fall
The Conference Board Consumer Confidence Index improved to 101.5 from the 99.8 reported last month. The market expected (from Bloomberg) this index to come in at 90.8 to 96.8 (consensus 94.0) versus the 101.5 reported. |
| Gold Slammed Back Below Key Technical SupportSince ‘everything is awesome’ once again, it appears holding ‘pet rocks’ is no longer of any use… Gold futures have been hammered below their 50-day moving-average this morning as the USD rises… Gold down on heavy volume…
Silver is not escaping the damage either – having broken support yesterday…
Which is interesting since stocks are also being sold…
Charts: Bloomberg |
| Richmond Fed Manufacturing Survey Shows No Growth in August 2015 – Below Expectations.
Of the three regional Federal Reserve surveys released to date, one shows manufacturing expanding, one is flat, and one is in contraction. |
| Richmond Fed Manufacturing Collapses To 2015 Lows, Drops Most In 9 YearsThe 3-month bounce in the Richmond Fed Manufacturing survey… is dead. From 13 in July, August saw it collapse to 0 (massivley missing expectations of a 10 print). This is the biggest absolute drop in the index since May 2006. Across the board, underlying factors crashed with Shipments plunging, New Orders cliff-diving, order backlogs disappearing and Capacity Utilization plunging. This is exactly what we would expect after a massive inventory build up that was not accompanied by a surge in sales… but the pundits stil proclaim “no signs of an imminent US recession.” Manufacturing collapses…
The biggest drop in Order Backlogs in history…
Charts: Bloomberg |


 Written by Doug Short and Steven Hansen


Earnings Summary for Today
leading Stock Positions
Current Commodity Prices
Commodities are powered by Investing.com
Current Currency Crosses
The Forex Quotes are powered by Investing.com.
To contact me with questions, comments or constructive criticism is always encouraged and appreciated:


