by Lance Roberts, Clarity Financial
In this past weekend’s newsletter, I discussed the rarity of 6-positive market months in a row.

Please share this article – Go to very top of page, right hand side, for social media buttons.
To wit:
“An additional ‘red flag’ is the S&P 500 has had positive returns for 6-straight months. As shown in the 10-year monthly chart below, such streaks are a rarity, and when they do occur, they are usually met by a month, or more, of negative returns.”
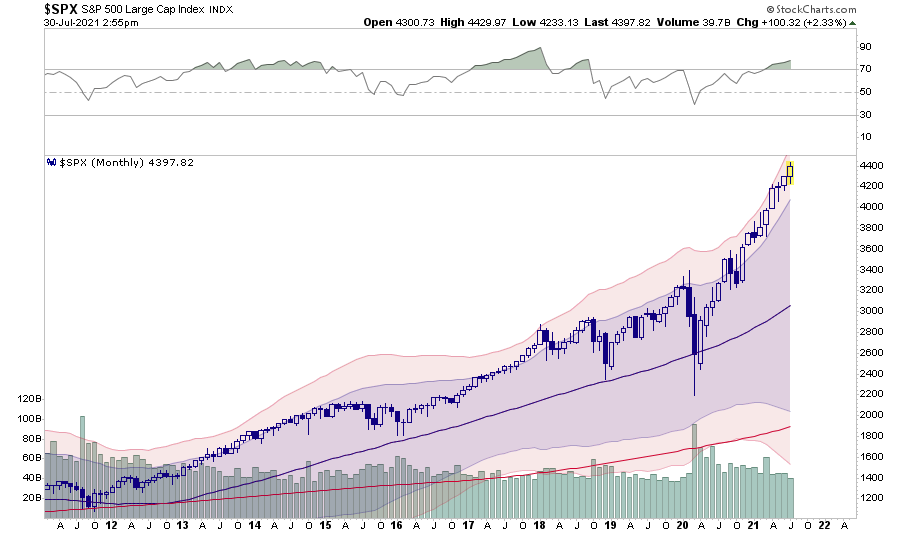
(It is also worth noting that when the 12-Month RSI is this overbought, larger corrective processes have occurred.)
As stated, I only went back 10-years in the chart above. Such generated several email questions asking about the number of historical occurrences over the long term.

6-Positive Market Months – Long Term
Using Dr. Robert Shiller’s long-term nominal stock market data, I calculated monthly positive returns and then highlighted periods of 6-positive market months or more.
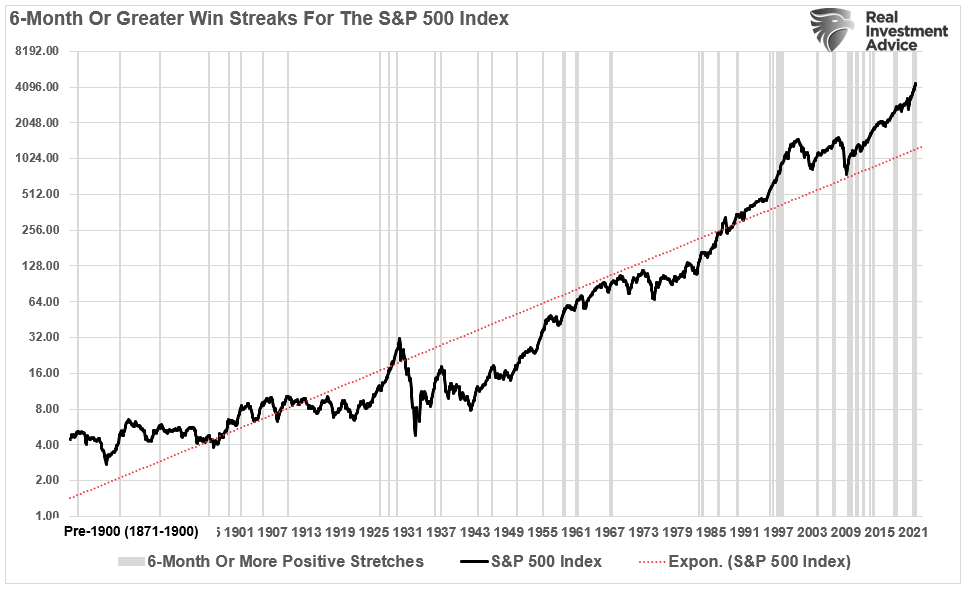
There are several important takeaways from the chart above.
- All periods of consecutive performance eventually end. (While such seems obvious, it is something investors tend to forget about during long bullish stretches.)
- Given the extremely long-period of market history, such long-stretches of bullish performance are somewhat rare.
- Such periods of performance often, but not always, precede fairly decent market corrections or bear markets.
The table below shows all periods where there were 2-months or more of consecutive positive returns.
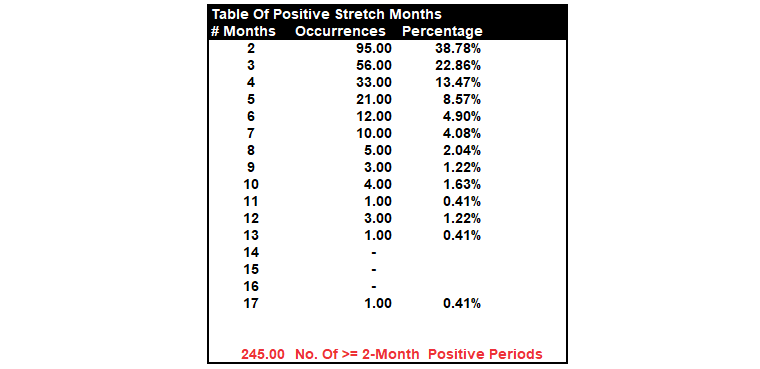
What the table shows is that nearly 40% of the time, a two-month stretch of positive performance is followed by at least one month of negative performance. Three consecutive positive months occur 23% of the time, and only 14% of occurrences stretch to 4-months.
Since 1871, there have only been 12-occurrences of 6-month or greater stretches of positive returns before a negative month appeared. In total there are just 40 occurrences, out of 245 periods of 2-months or more, the market ran 6-months or longer without a correction.
However, in every period, the run ended in at least a negative return month, but the vast majority ended with much deeper corrections.
This Time Is Different
At the current time, there is no concern about “risk” in the financial markets as the “bullish bias” remains unfettered. With the Fed still applying $120 billion a month in liquidity, investors learned the meaning of “the beatings will continue until morale improves.”
It is certainly possible the market advance can continue unabated into one of the historically lengthier stretches. The only question is when will it end, and how big of a correction will it be?
What will cause the correction is unknown? The reason is that if the market becomes aware of an issue, participants “price” that “risk” into markets. Such is why, particularly when investors are aggressively positioned in the market when an unexpected, exogenous, event occurs prices decline rapidly as “risk” gets reduced.
Such is why the market was holding up fairly well in the face of the “Pandemic” in February of 2020. However, what market participants were not prepared for, the “exogenous” event, was the complete “shutdown” of the economy.
So, whatever event causes a rush of investors to the “exits,” is not something we are currently discussing or worried about in the financial media.
Size Of The Correction
The magnitude of the correction is an easier question to answer.
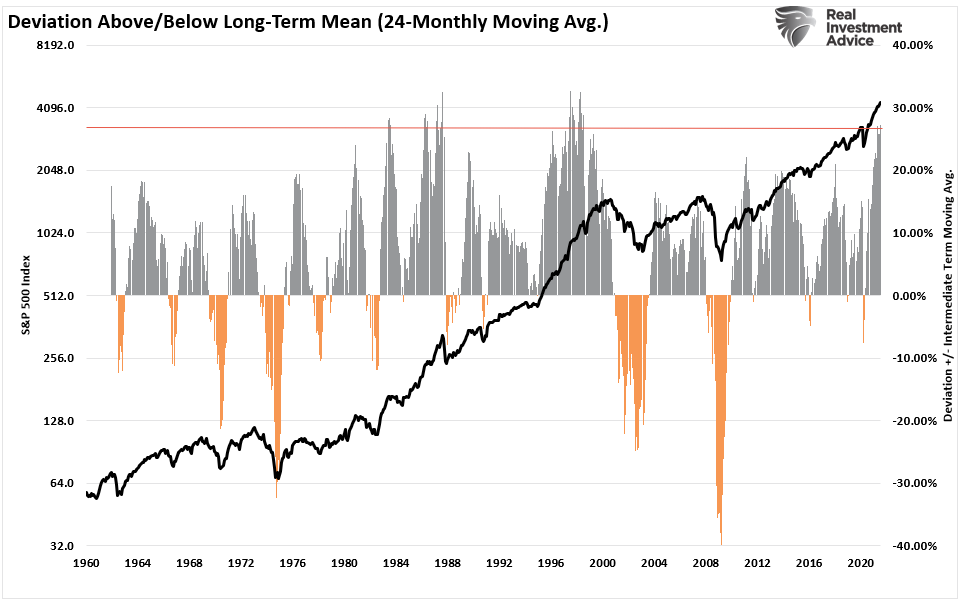
Currently, the market is extremely deviated above its 2-year (24-month) moving average. Such extreme deviations are a historical rarity and have often resulted in corrections of 20% or more.
As we showed in “Past Performance Is No Guarantee“,
“This is also where investors should be paying attention to the ‘risk’ they are taking on. As shown, there are few points in history where the index, monthly, is this extended, deviated, and bullish.”
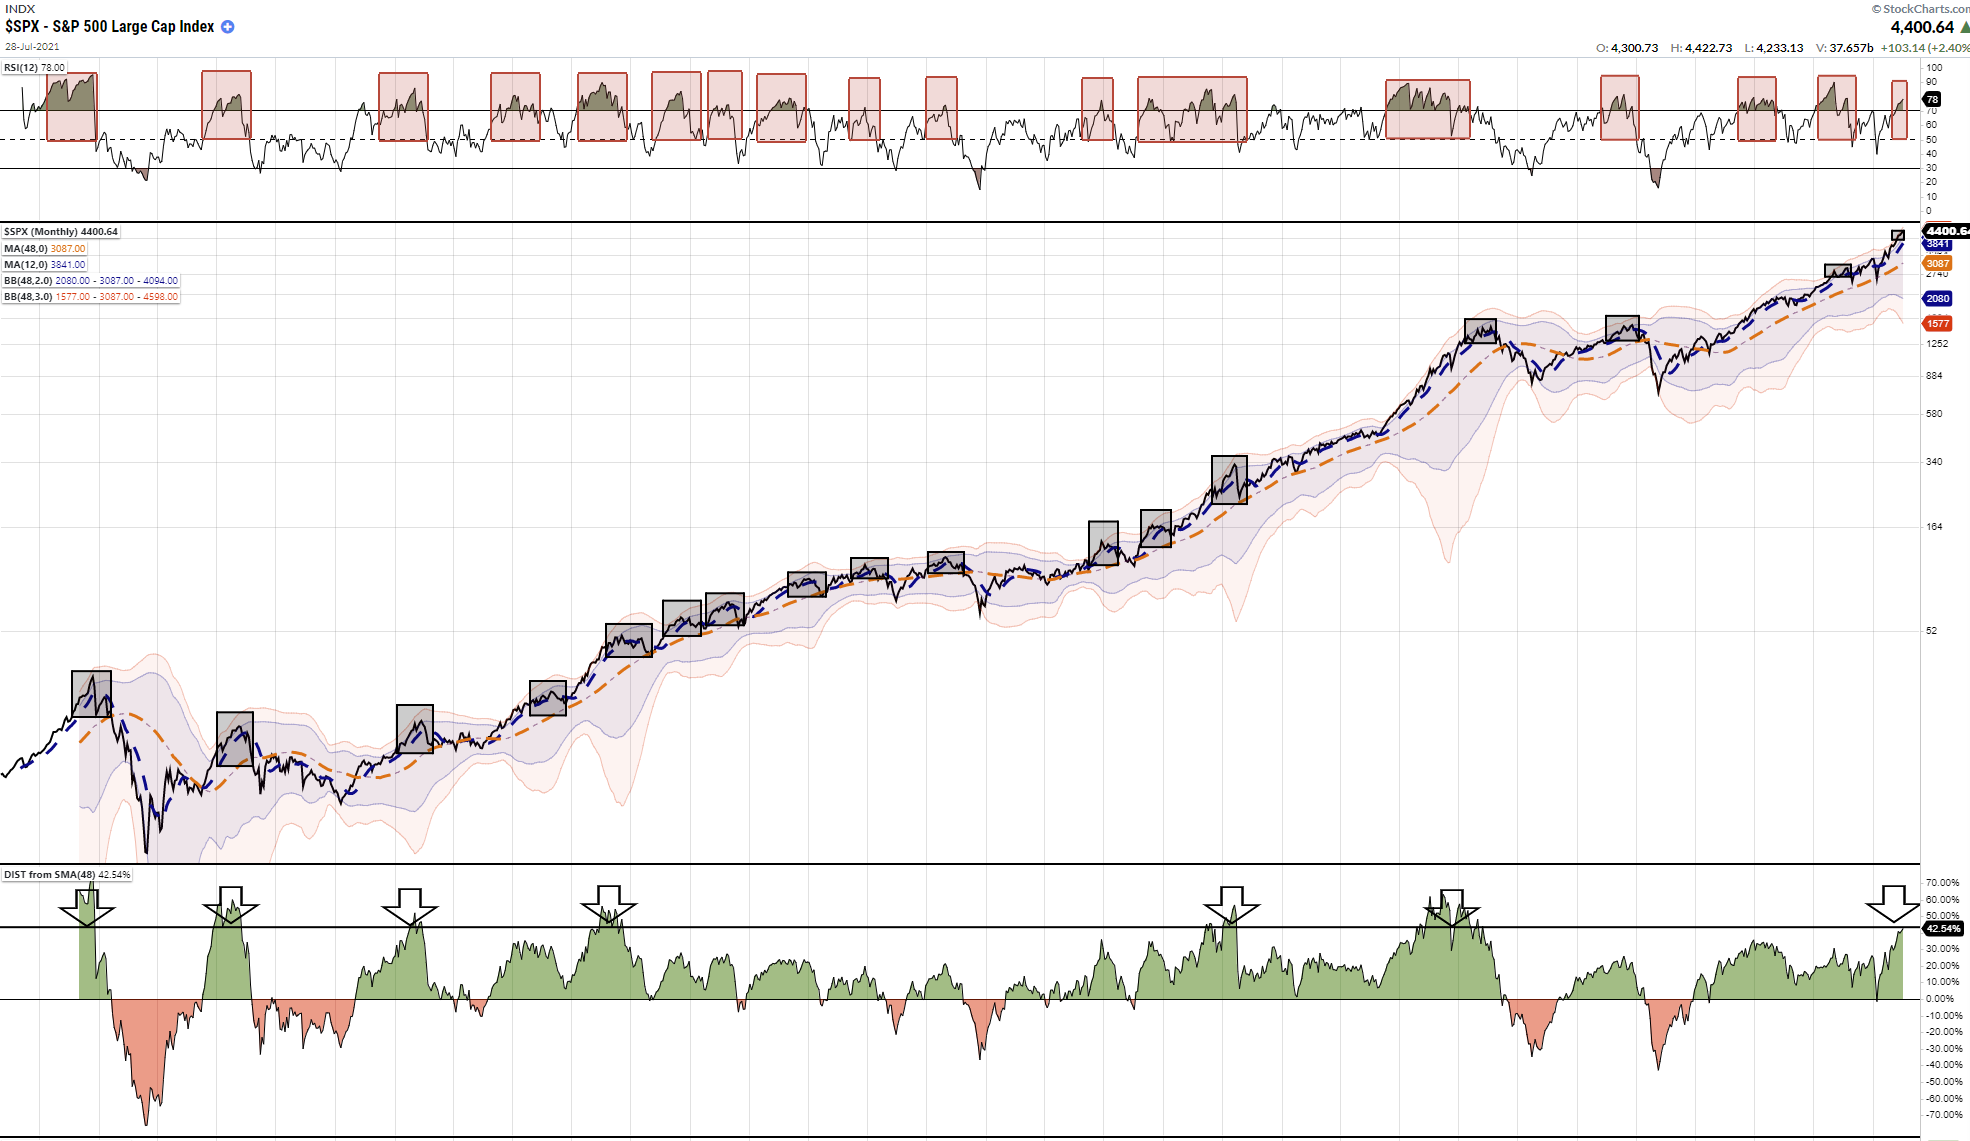
There have only been 6-previous points in history where markets were simultaneously this extended, bullish, and overbought. Each of those periods marked more historical performance peaks – 1929, 1937, 1946, 1957, 1987, 1999.
Importantly, the 72-month moving average has acted as long-term running support for the market going back to 1925. Violations of that moving average are rare and only occur during “mean-reverting” bear markets. Currently, a correction to the 72-month moving average would require a 36.5% decline.
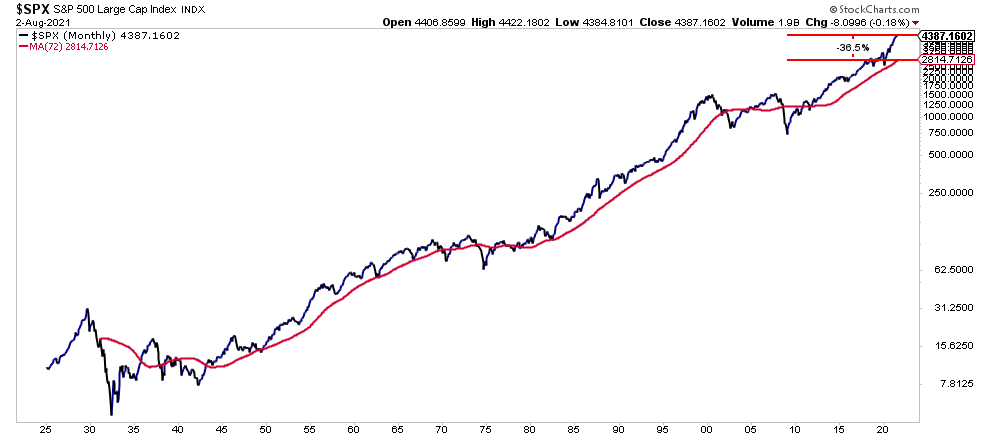
Currently, such a correction seems unlikely given the current “bullish sentiment.” However, the same sentiment abounded in February 2020 just before the market tested that support.
Given the massive deviations from long-term means, our suspicion is that at some point we will likely again test that support in the future.
Into The Belly Of The Beast
The market is currently priced for perfection. Investors continue to disregard warnings of slowing economic growth on hopes that monetary interventions will continue indefinitely. While such could indeed be the case, that does not preclude the market from having a correction or worse.
Interest rates continue to decline sharply suggesting that economic growth is weakening rapidly. Such will lead to earnings disappointment in the months ahead at a time when valuations remain excessive on many levels.
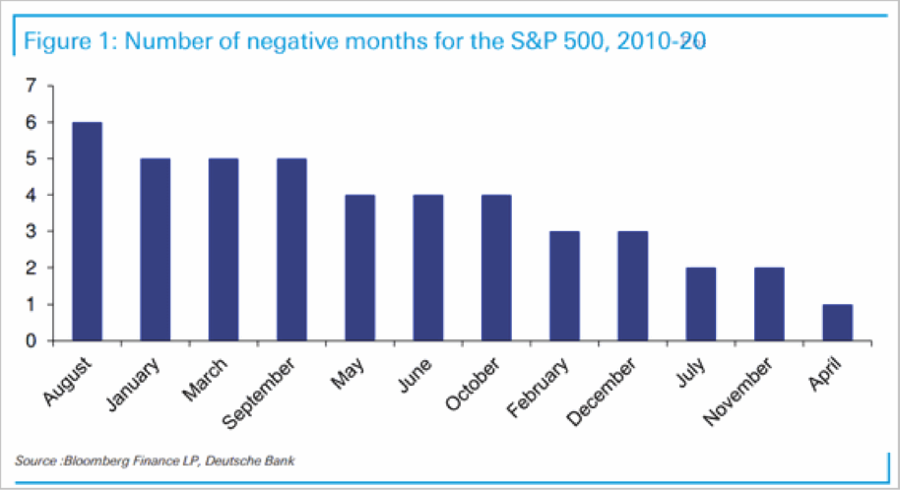
August and September historically sport weak performance for the market for a variety of reasons. However, given 6-positive market months already, the risk of a correction has risen markedly.
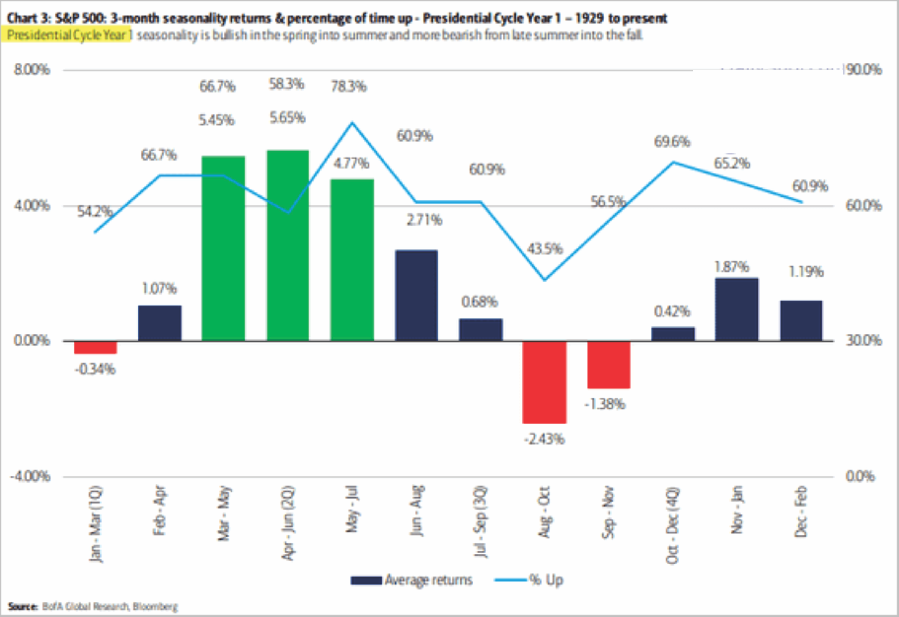
The first year of a new-President also sports weak performance during the August-September period. With the “debt ceiling” approaching, the Fed potentially discussing “tapering” asset purchases, and the potential for disappointment in economic reports, there are plenty of things to “spook” markets.
The point is simply that the “risk” of a correction is now elevated.

What This Means And Doesn’t Mean
Let me repeat the following just so there is no confusion.
“What this analysis DOES NOT mean is that you should ‘sell everything’ and ‘hide in cash.'”
As always, long-term portfolio management is about managing “risk” by “tweaking” things over time.
If you have a “so so” hand at a poker table, you bet less or fold.
It doesn’t mean you get up and leave the table altogether.
What this analysis does suppest is that we should use rallies to rebalance portfolios.
- Trim Winning Positions back to their original portfolio weightings. (ie. Take profits)
- Sell Those Positions That Aren’t Working. If they don’t rally with the market during a bounce, they will decline more when the market sells off again.
- Move Trailing Stop Losses Up to new levels.
- Review Your Portfolio Allocation Relative To Your Risk Tolerance. If you have an aggressive allocation to equities at this point of the market cycle, you may want to try and recall how you felt during 2008. Raise cash levels and increase fixed income accordingly to reduce relative market exposure.
Could I be wrong? Absolutely.
But what if the indicators are warning us of something more significant?
What’s worse:
- Missing out temporarily on the initial stages of a longer-term advance, or;
- Spending time getting back to even, which is not the same as making money.
As I noted recently in our blog on trading rules:
“Opportunities are made up far easier than lost capital.” – Todd Harrison


include(“/home/aleta/public_html/files/ad_openx.htm”); ?>


