by Callum Thomas, Topdown Charts
The Chart Storm is a weekly selection of 10 charts which I hand pick from around the web (plus some of my own charts), and then post on Twitter.
The charts focus on the S&P500 (US equities); and the various forces and factors that influence the outlook – with the aim of bringing insight and perspective.

Please share this article – Go to very top of page, right hand side, for social media buttons.
1. S&P500 – Equal Weighted Index: After a 3-month range-trade, the *equal weighted* index is breaking out to new highs. It’s also turning the corner vs the market cap-weighted index: is this an end to the “stealth correction”?
![]()
Source: @Callum_Thomas
2. Market Breadth: On a very similar note, 50-day moving average breadth is starting to convincingly turn up after a few months of very narrow leadership: basically as I noted last week – there was a period of “unrotation“. The resolution of this underlying weakness to the upside would be a very bullish development.
![]()
Source: @Callum_Thomas
3. S&P500 to 6000? Personally I don’t like to make big multi-year forecasts, but I would say, given where valuations are, earnings are going to have to do a lot of heavy lifting for this to happen. I would also concede that 6000 in 2025 is “only“ 8% annualized.
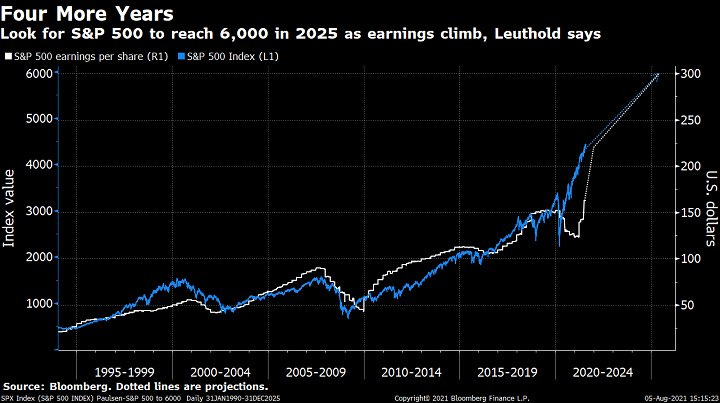
Source: @MichaelaArouet and @markets
4. Earnings Revisions: Earnings revisions remain very strong – perhaps a surprise for some that, even after unwinding the pandemic panic, earnings estimates continue to be revised higher.
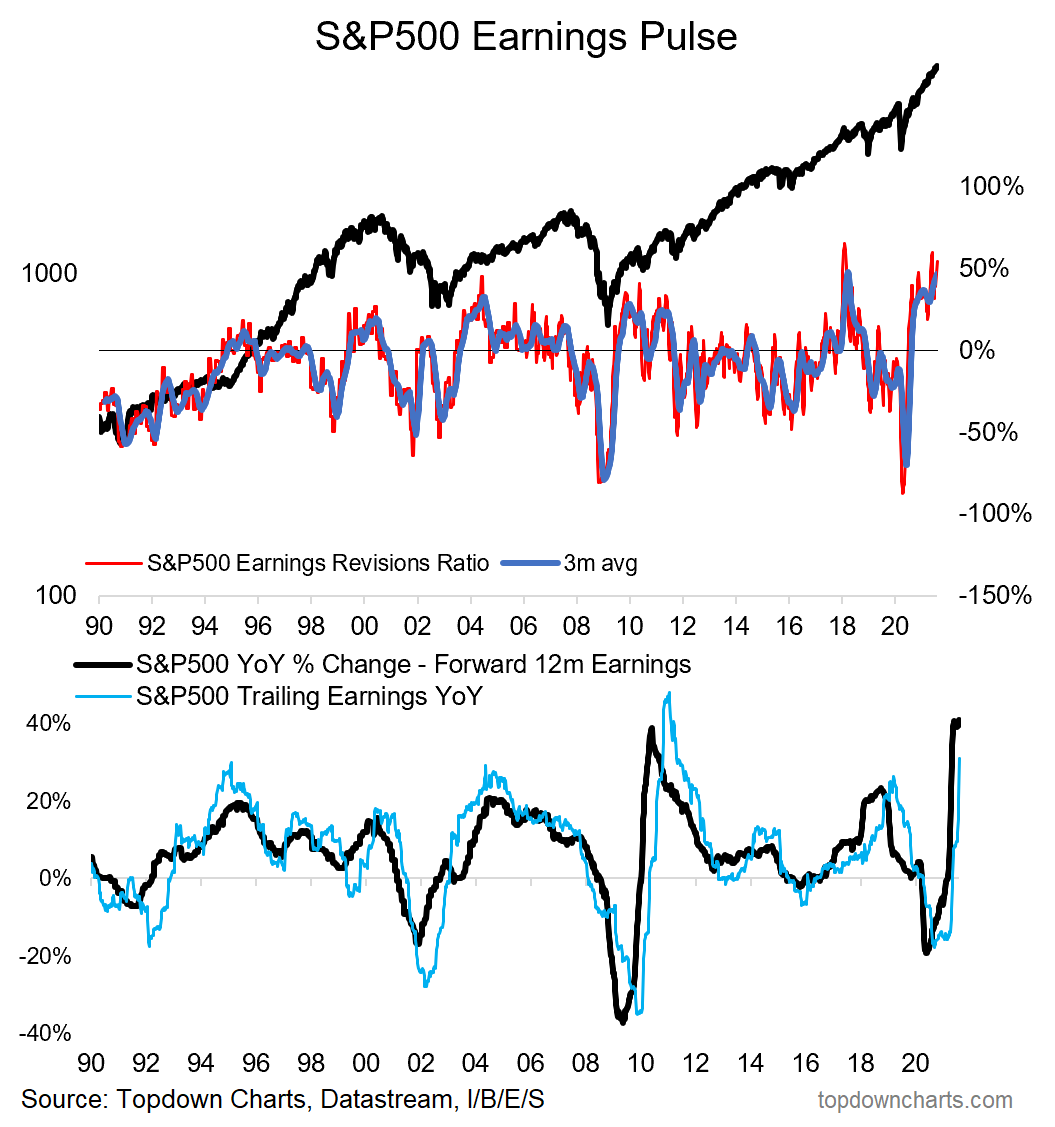
Source: @topdowncharts
5. Wall Street Analyst Buy Ratings: A sign of the times – the proportion of buy recommendations by sell-side analysts has reached the highest level since SOX came into force (which, among other things, dealt with analyst conflicts of interest e.g. where analysts were sometimes pressured to give favorable ratings to investment banking clients). I guess when you are in a raging bull market, it’s hard to swim against the tide.
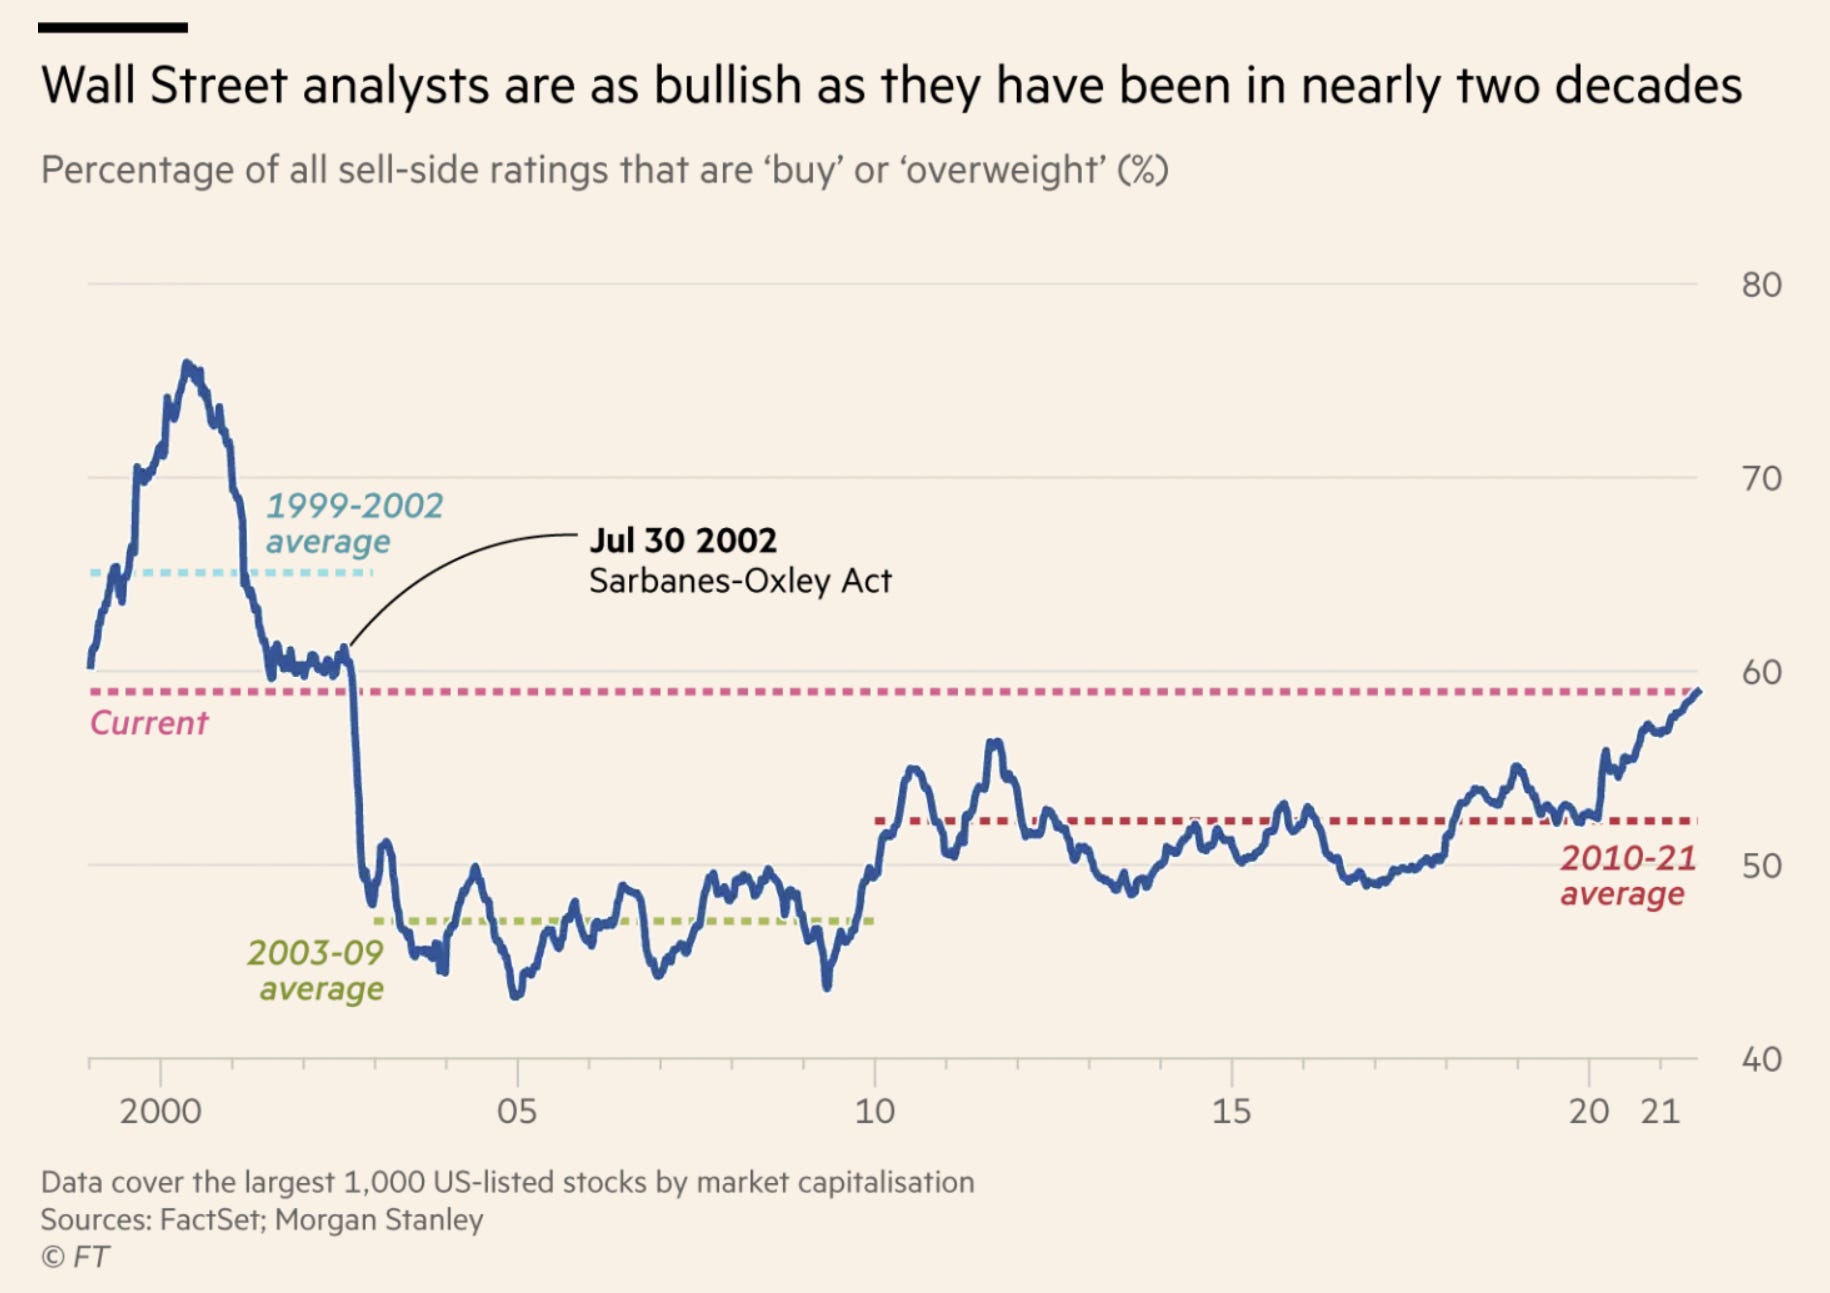
Source: @PriapusIQ
6. Junk Bond Divergence: Another risk indicator to keep an eye on; the advance-decline line for US corporate high yield bonds has tapered off – basically a minor bearish divergence. It’s entirely possible that it ends up resolving to the upside, but a risk indicator keep an eye on nonetheless.
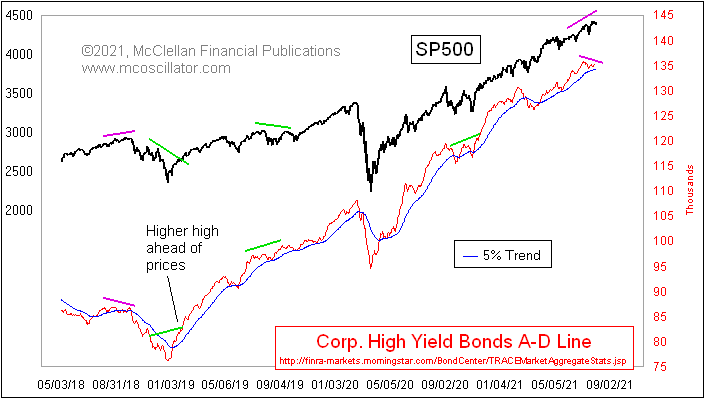
Source: @McClellanOsc
7. Financials Sector vs Bond Yields: As bond yields go, so does US financials’ relative performance. The drop in yields and un-rotation back out of financials has been fairly sharp and resolute – but with both bouncing off support, there is a chance…
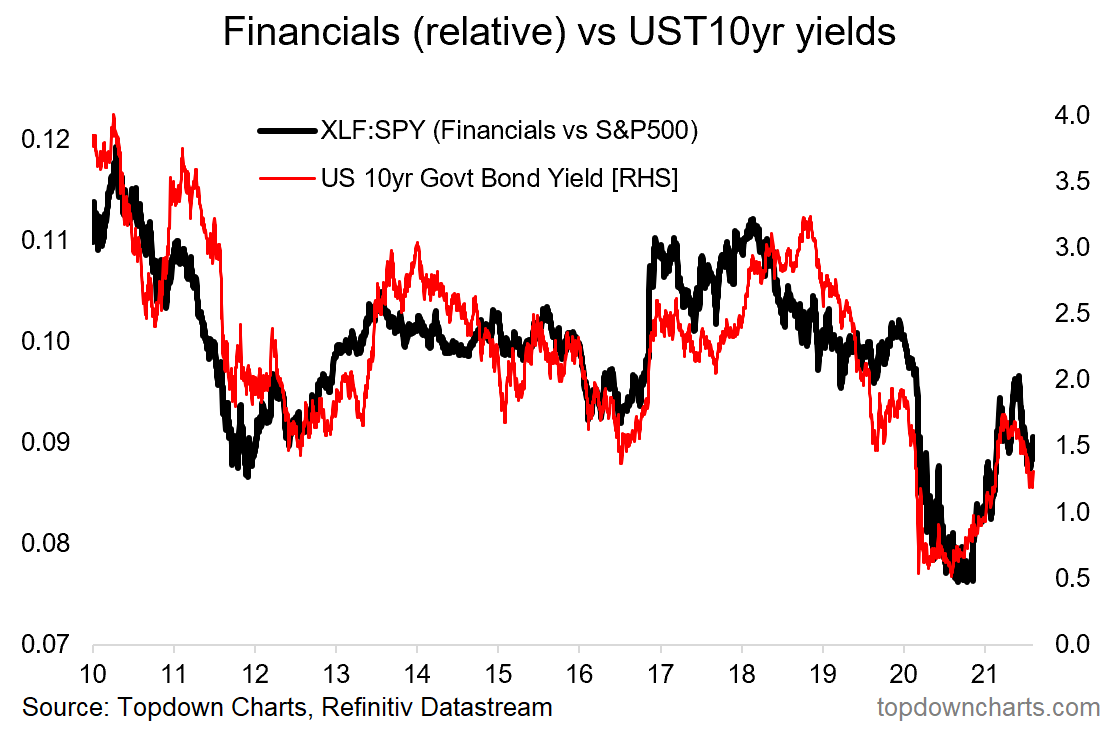
Source: Blog: Banking on Banks
8. Bank ETF Flows: On a very much related note, here we can see the extent to which investors initially piled into bank stocks… and then summarily dumped them on the first signs of weakness. While bank stocks could go lower, and outflows might increase further; this looks like a classic capitulation, and all else equal – a contrarian bullish signal.
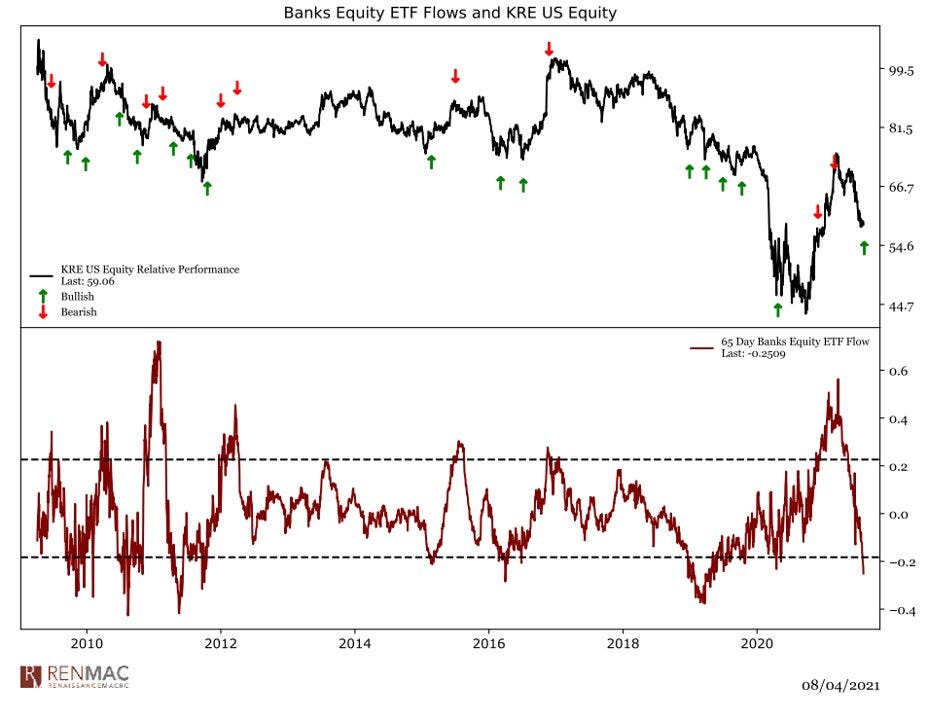
Source: @RenMacLLC
9. Gold vs the S&P 500: Gold had a very strong run against the equities in the initial phase of the pandemic panic, but since then has been a near-consistent underperformer in relative terms. I think it’s hard to get excited about gold in the absence of a renewed crisis or bear market. But on the other hand, you might suggest that gold is starting to look cheap vs stocks.
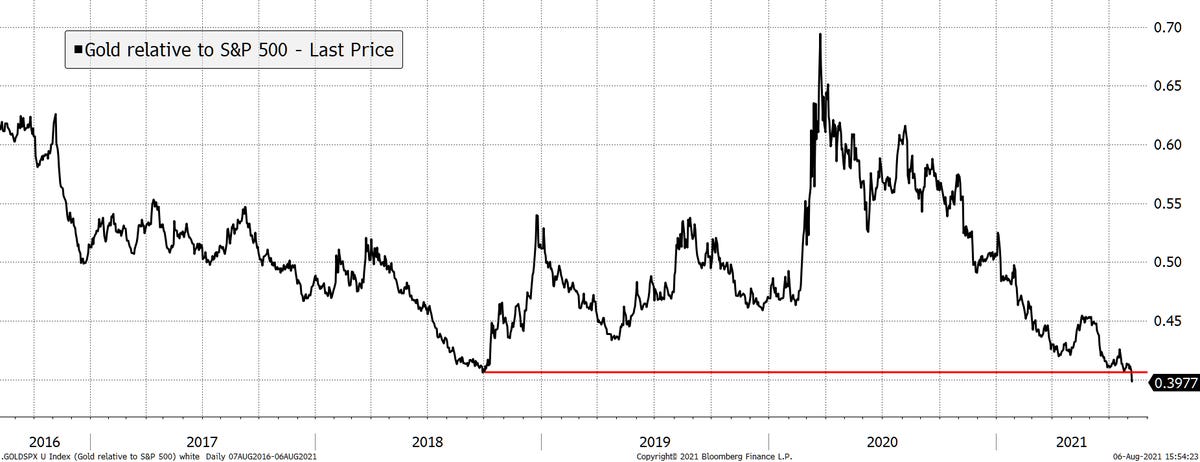
Source: @AtlasPulse
10. Gold Miners vs the S&P500: On a very similar note, gold miners have been a relative laggard of late; coming all the way down to test their uptrend line of the past decade. On my metrics gold miners do look cheap relative to the S&P500, but of course the other key ingredients for gold miners to outperform are: higher gold prices, and/or lower stock prices. Also, note the late-90’s as a downside cautionary.
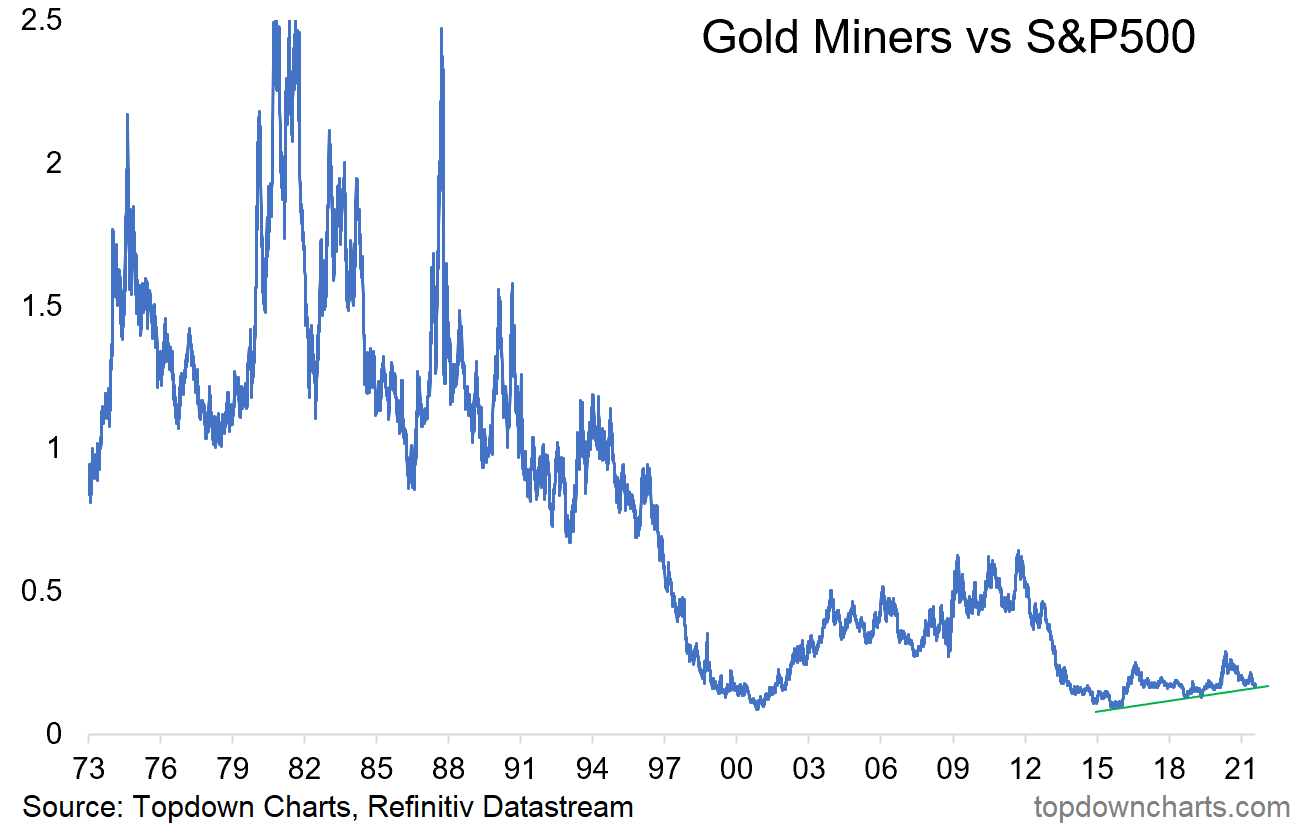
Source: @topdowncharts
Thanks for following, I appreciate your interest!
oh… that’s right, almost forgot!
BONUS CHART
Lending Standards: Last week we got the Fed Senior Loan Officer Opinion Survey results, and there were some pretty interesting developments in some of the key indicators within that dataset.
Of most note, the net percentage of domestic respondents tightening standards for Commercial and Industrial Loans dropped to a record low: indicating that banks are loosening up again and have a much greater appetite to make new loans. Historically this has been a very good sign for markets.
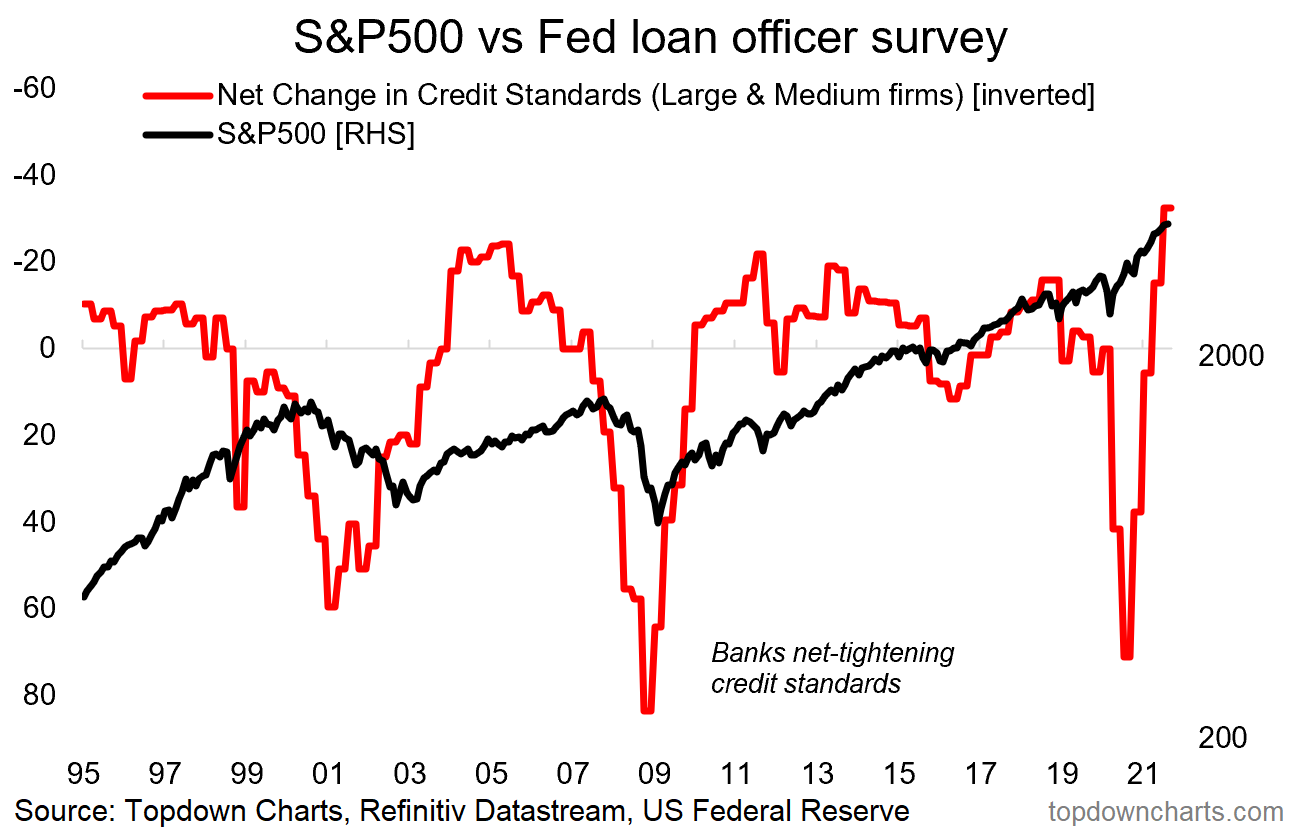
Indeed, I keep track of these indicators partly simply as a risk indicator e.g. in 2000 and 2007, lending standards began trending toward tightening; offering advance warning of major bear markets.
For completeness, I thought I would also show the annual rate of change in the S&P500 vs the net change in lending standards (shown inverted). Again we can see how intertwined the two series are.
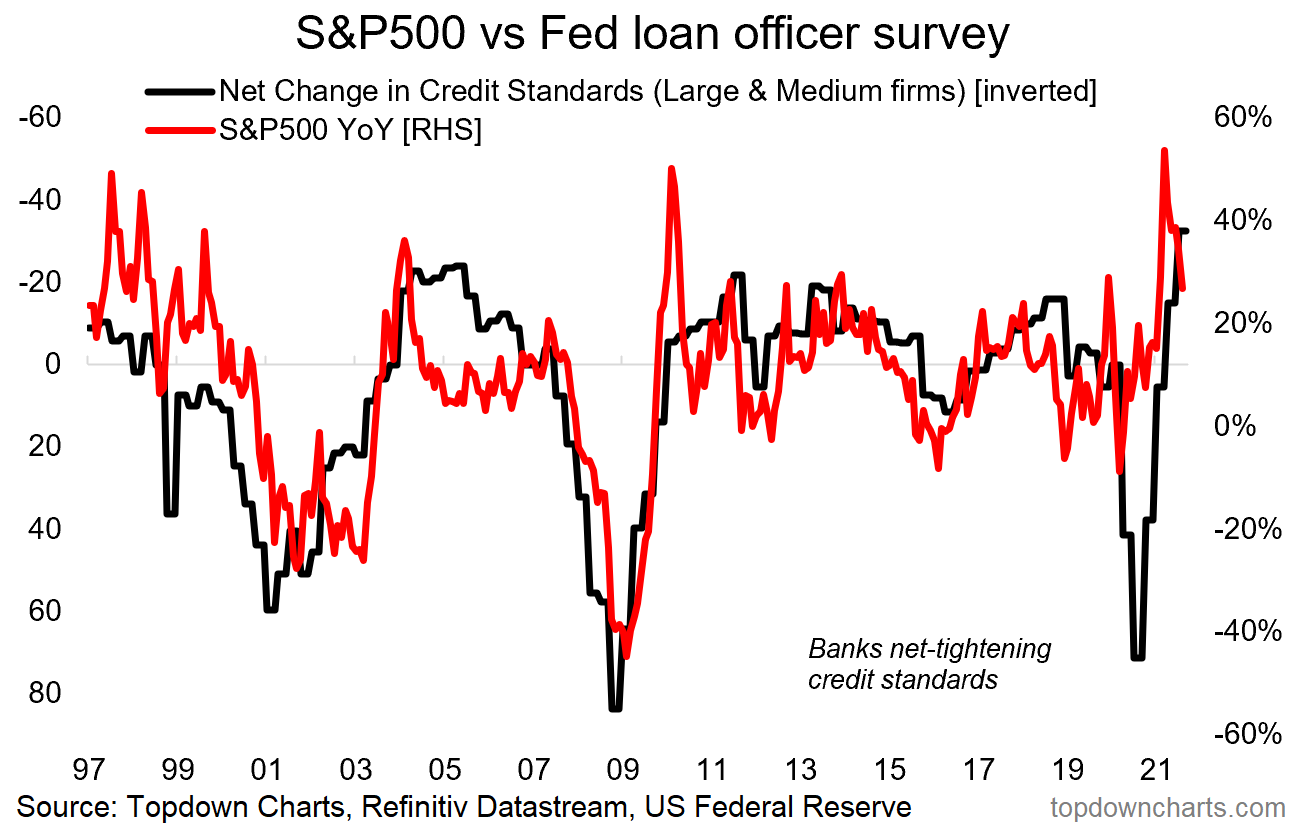
There’s good reason for these interlinkages: banks tighten-up when economic times are bad and uncertainty is elevated. Meanwhile during the good times when sentiment is more optimistic; banks tend to relax more as better economic conditions drive better credit quality, and of course greater demand for loans.
Of course it should be noted that things are indeed different this time in many respects, but on first glance, it looks like reason for optimism.
.


