by Lance Roberts, Clarity Financial
Last week, we discussed that as the market hit new highs, further upside was likely limited.

Please share this article – Go to very top of page, right hand side, for social media buttons.
To wit:
“While the upside remains somewhat limited, given the already substantial advance this year, the rally will alleviate downside concerns momentarily. However, with that said, the extremely low level of volatility this year is reminiscent of 2017. The reason is that “stability” is fragile. In other words, stability ultimately leads to instability.”
For more information on the “instability of instability“, read “The Next Minsky Moment“.
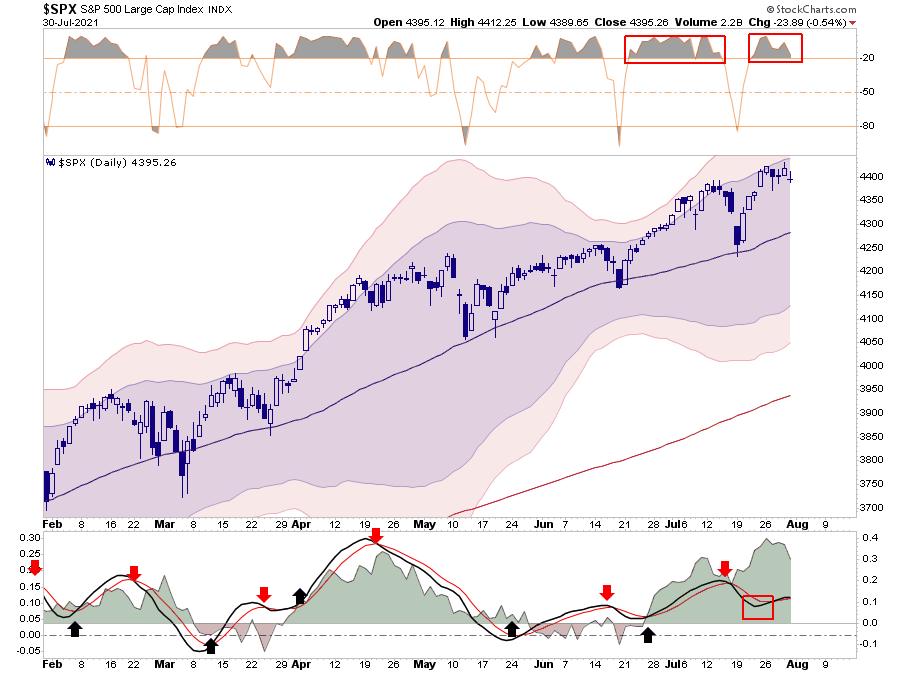
Not surprisingly, the market didn’t make much headway this past week, given the current extended and overbought conditions. For now, “buy signals” remain intact, which likely limits the downside over the next week. However, a retest of the 50-dma is certainly not out of the question.
With that said, we are entering into the two weakest trading months of the year. Stocktrader’s Almanac had a good note on why the rally could experience a “pause” over the next two months.
“For the past 33 years from 1988-2020 August and September are the worst two months of the year for DJIA, S&P 500, and NASDAQ. August is the worst for DJIA and S&P 500 and September is worst for NASDAQ.
Despite the persistence and resilience of this bull rally market internals and technicals are showing some signs of fatigue.”
- Advancing issues have barely outpaced decliners in recent weeks.
- New highs have been shrinking while new lows remain high.
- Technical indicators are struggling to break through resistance.
- Relative Strength, Stochastics and MACD are breaking down again.
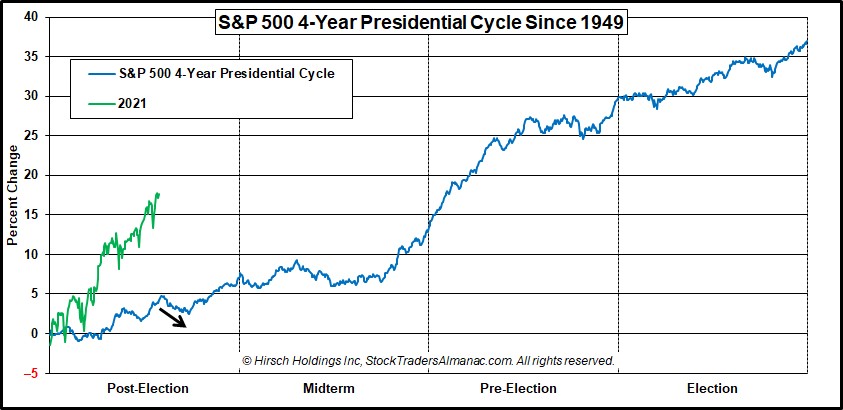
“The timing of a pause coincides with the weak seasonal patterns mentioned above during the worst months of the year August and September (not to mention Octoberphobia) as well as the 4-Year Presidential Election Cycle.”
6-Month Advances Are Rare
Given the bullish bias currently remains unfettered, and the Fed is still applying $120 billion a month in liquidity, there is no reason to be overly “bearish” at this juncture. Thus, while we are carrying slightly reduced exposure currently and have increased our “risk hedges” as of late, we remain nearly fully invested.
With our “money flow buy signals” triggered, such suggests there is support for stocks currently. Such means two things over the next week or so: 1) there is not a great deal of downside, and 2) there is not much upside either. Thus, a sideways consolidation and a pickup in volatility are likely. One concern is the “negative divergence” of money flows (bottom panel) against an advancing market. Such corresponds with the technical weakness we will discuss momentarily.
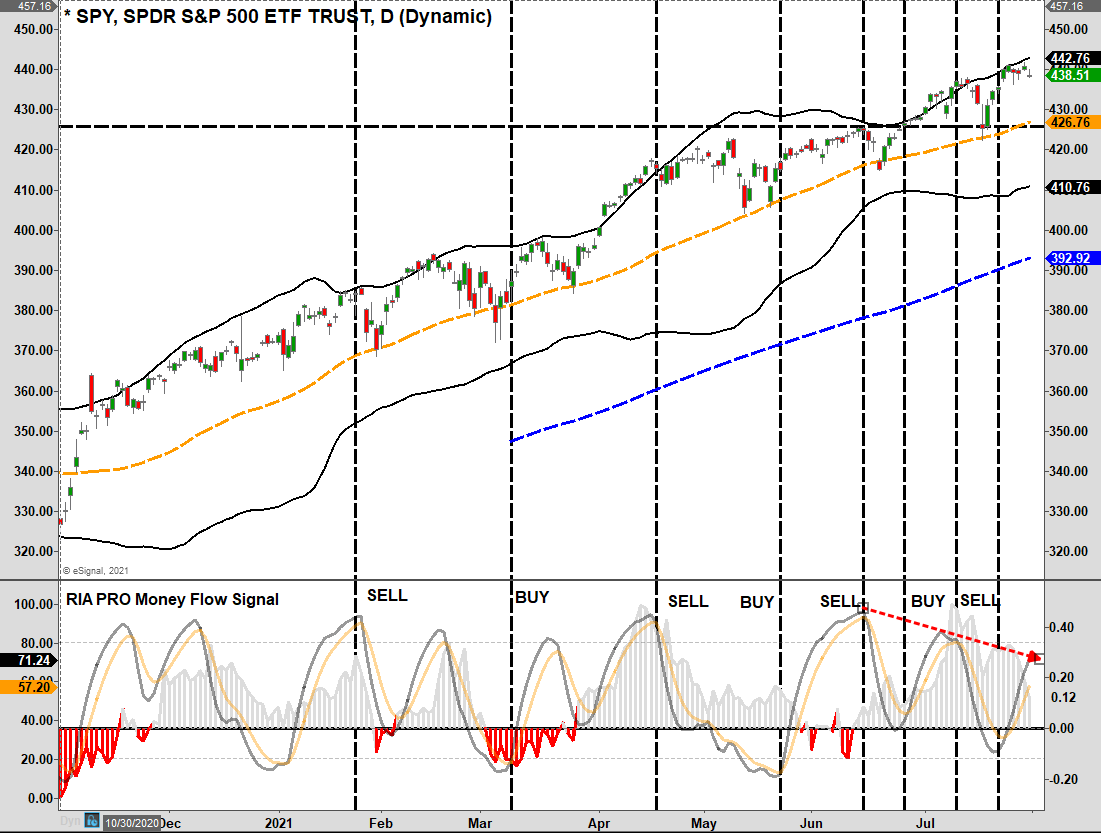
Therefore, given this backdrop, we increased portfolio hedges.
An additional “red flag” is the S&P 500 has had positive returns for 6-straight months. As shown in the 10-year monthly chart below, such streaks are a rarity, and when they do occur, they are usually met by a month, or more, of negative returns.
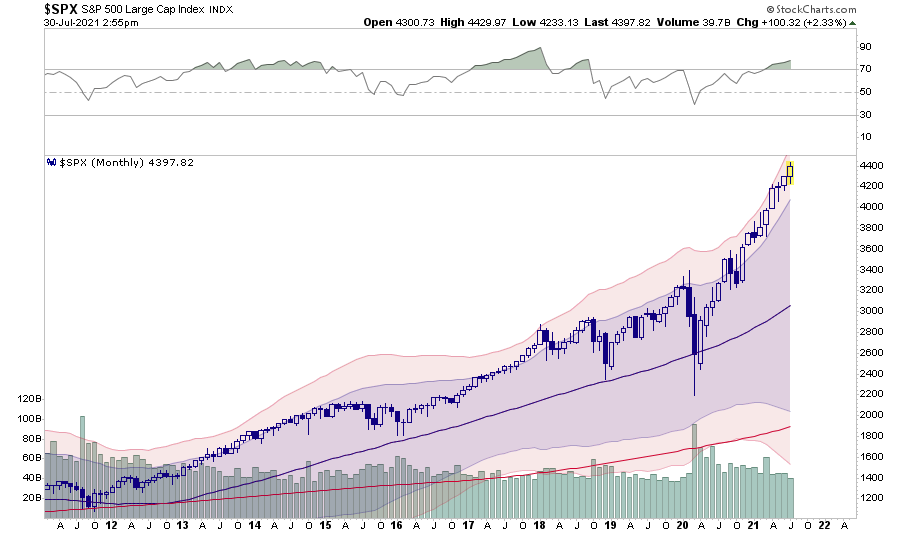
(It is also worth noting that when the 12-Month RSI is this overbought, larger corrective processes have occurred.)
While prices have advanced sharply, the bullish mantra remains that “earnings” support the increase. While that “rationalization” may seem to have merit, investors are paying more today for the same expected earnings from January of 2020.
.
include(“/home/aleta/public_html/files/ad_openx.htm”); ?>


