by Lance Roberts, Clarity Financial
Both Michael Lebowitz and I recently discussed the Fed starting to “think about thinking about tapering.” This week’s Fed meeting was a clear indication such was in play and will likely get announced at the annual Jackson Hole “confab” of Central Bankers.

Please share this article – Go to very top of page, right hand side, for social media buttons.
As noted following the latest FOMC meeting, the Fed kept the benchmark rate and the pace of bond-buying unchanged at $120 Billion per month. However, the most significant shift was the more hawkish tilt to its rate forecasts. As shown below, courtesy of Zerohedge, the median projections now show 2-rate hikes by end-2023. Notably, 7 of the FOMC members see a rate hike in 2022.
Chart courtesy of Zerohedge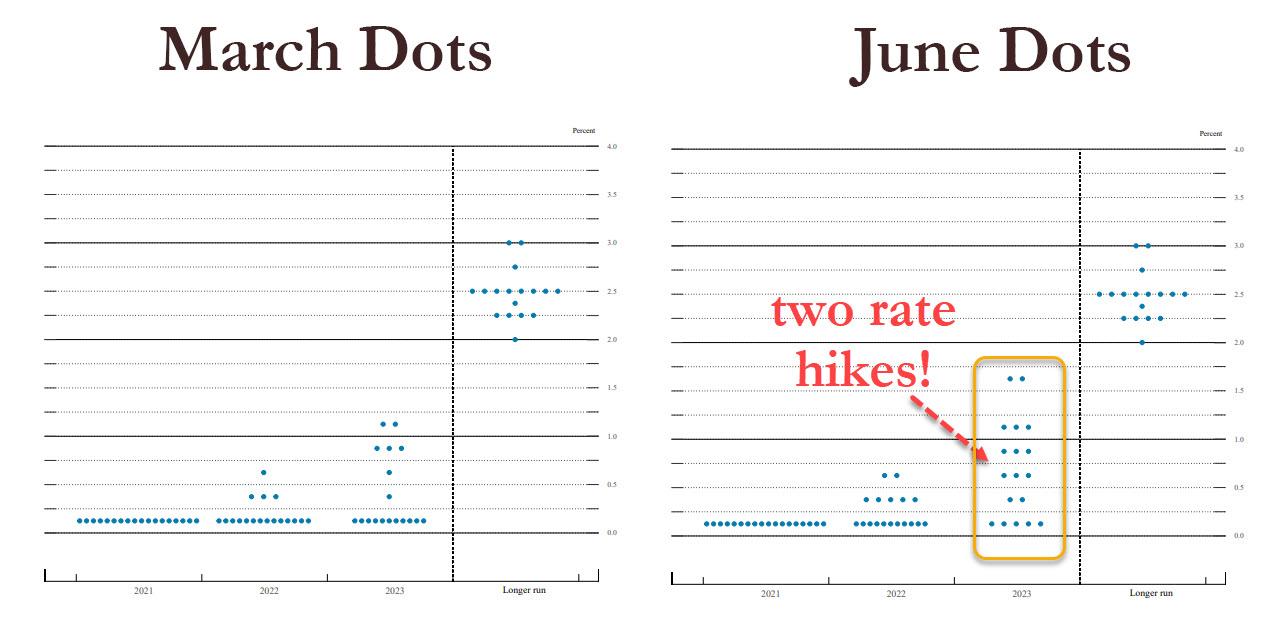
“For those confused by the Rorschach above, the 2023 median dot was a lot higher; in fact, only five members had rates unchanged up from 11 in March. The median is now 0.625% higher than anyone was reasonably expecting! That said, the sheer dispersion of dots in 2023 suggests the Fed doesn’t really know what the outlook looks like. Rather, the ‘median of 2 hikes’ in 2023 a byproduct of a lot of different views (on hawkish/dovish side). Such is not a clear message to the markets, and can easily change as soon as there is a deflationary whiff in the economy.”
– Zerohedge
There are two essential things to take away from that analysis.
- The announcement is very positive for the dollar and sets up the Fed to announce the beginning of the “taper” of the bond-buying programs; and,
- “This time is not different” as the taper and eventual rate hikes are bond positive and stock negative.
Taper Starts The Clock
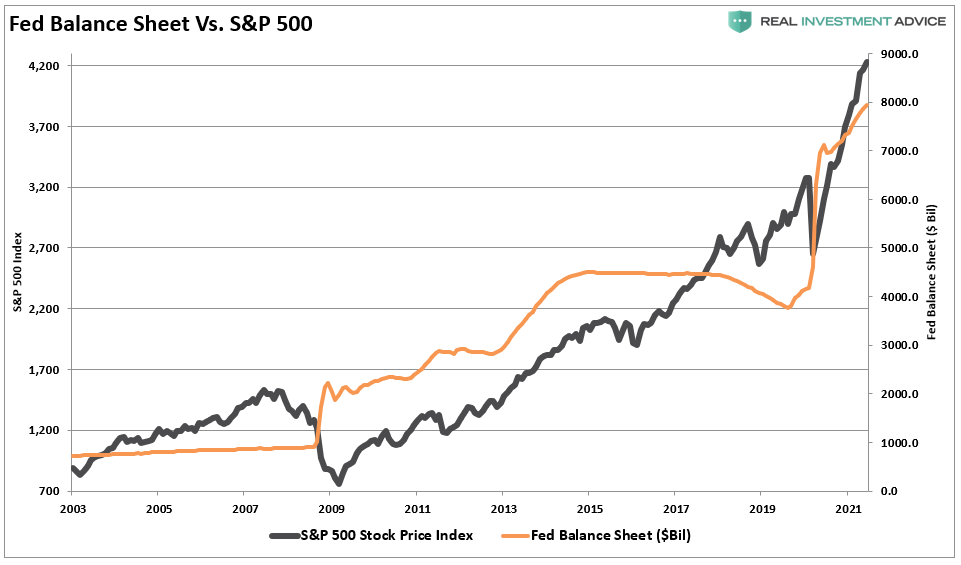
Despite comments to the contrary, the correlation between the Fed’s balance sheet and the S&P 500 is evident. Whether the correlation is due to liquidity moving into assets through leverage or just the “psychology” of the “Fed Put,” the result is the same.
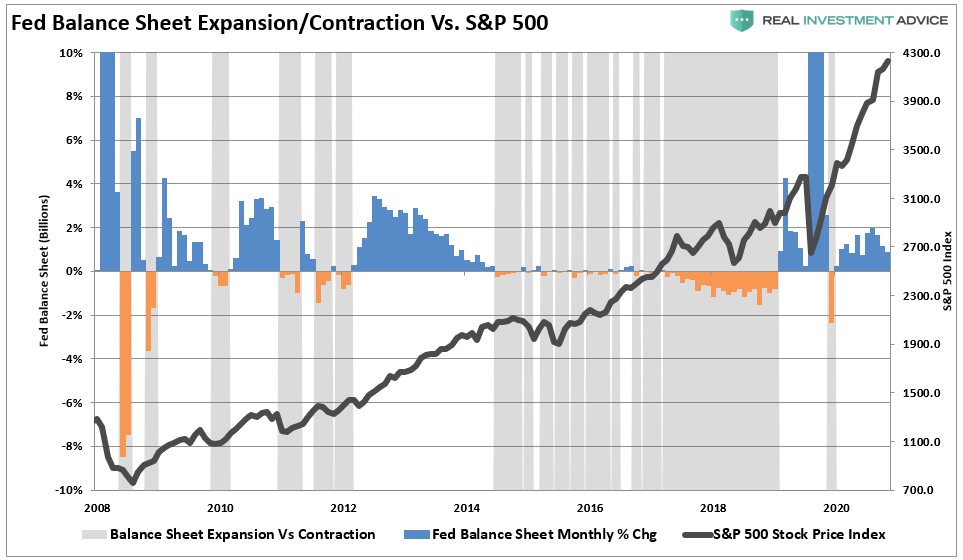
Therefore, it should also not be surprising that when the Fed starts “tapering” their bond purchases, the market tends to witness increased volatility. The grey shaded bars in the chart below show when the balance sheet is either flat or contracting.
The risk of a market correction rises further when the Fed is both tapering its balance sheet and increasing the overnight lending rate. The negative impact of tighter monetary policy on asset prices is of no surprise.
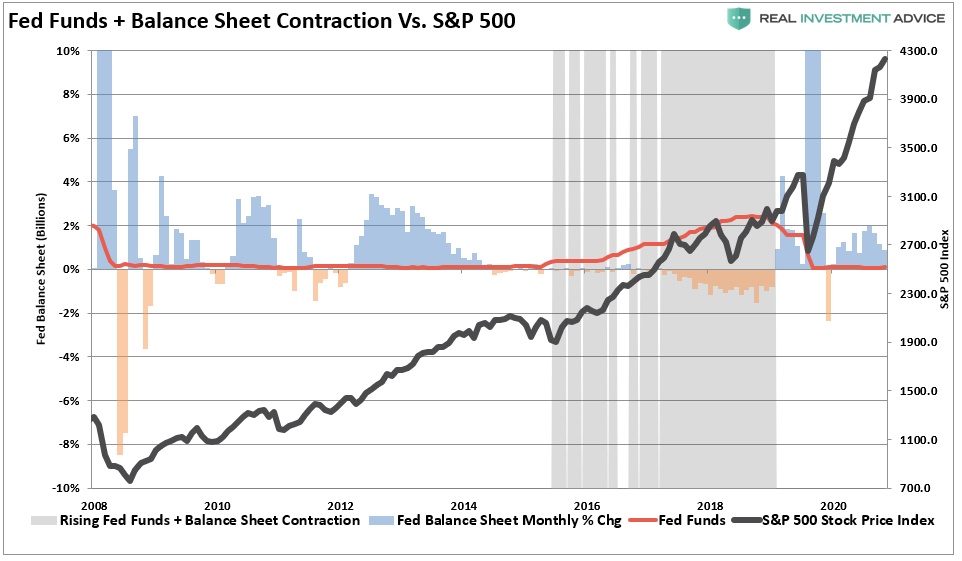
What we now know, after more than a decade of experience, is that when the Fed starts to slow or drain its monetary liquidity, the clock starts ticking to the next corrective cycle.


