by Lance Roberts, Clarity Financial
After a decent rally from the recent lows, there are multiple warning signs a correction approaches.
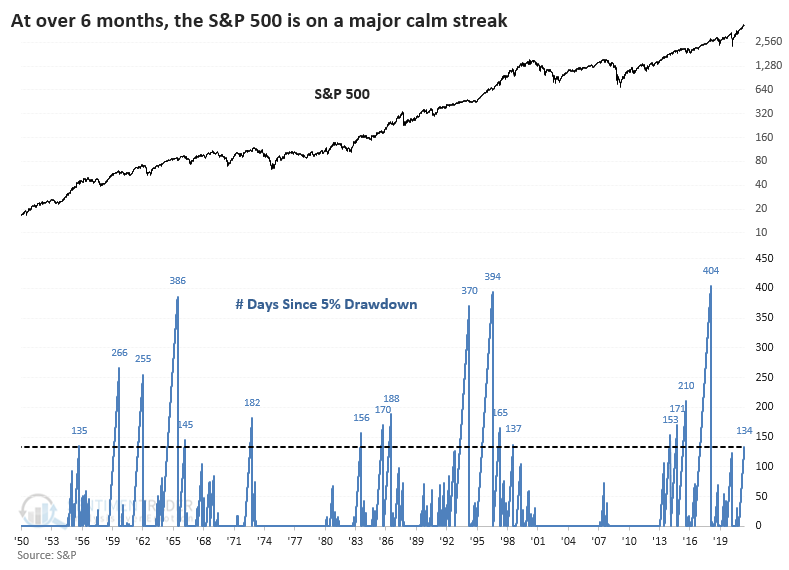
Over the last few weeks, we discussed the rising risk of a correction between 5-10%, most likely this summer. Such drawdowns are historically very common within any given year of an ongoing bull market. As Sentiment Trader recently noted, we are now in one of the more extended periods without such an occurrence.

Please share this article – Go to very top of page, right hand side, for social media buttons.
Of course, as is always the case, amid a bullish advance, it is easy to become complacent as prices rise.
Before we go any further, it is essential to clarify we are discussing only the potential for a short-term correction. As is often the case, some tend to extrapolate such to mean I am saying a “crash” is coming, and you should be all in cash. Such an extreme move is ill-advised without a significant weight of evidence.
However, there is reason to be cautious in the near term.
Suppressed Volatility
As I stated, during a “bullish advance,” investors become incredibly complacent. That “complacency” leads to excessive speculative risk-taking. We see clear evidence of that activity in various “risk-on” asset classes from Cryptocurrencies, to SPAC’s, to “Meme Stocks.”
A measure of speculative excess is the Volatility Index (VIX). The chart below is from my colleague Jim Colquitt of Armor ETF’s.
The top pane is the 15-day moving average of VIX, which is on an inverted scale. The bottom pane is the S&P 500 index.
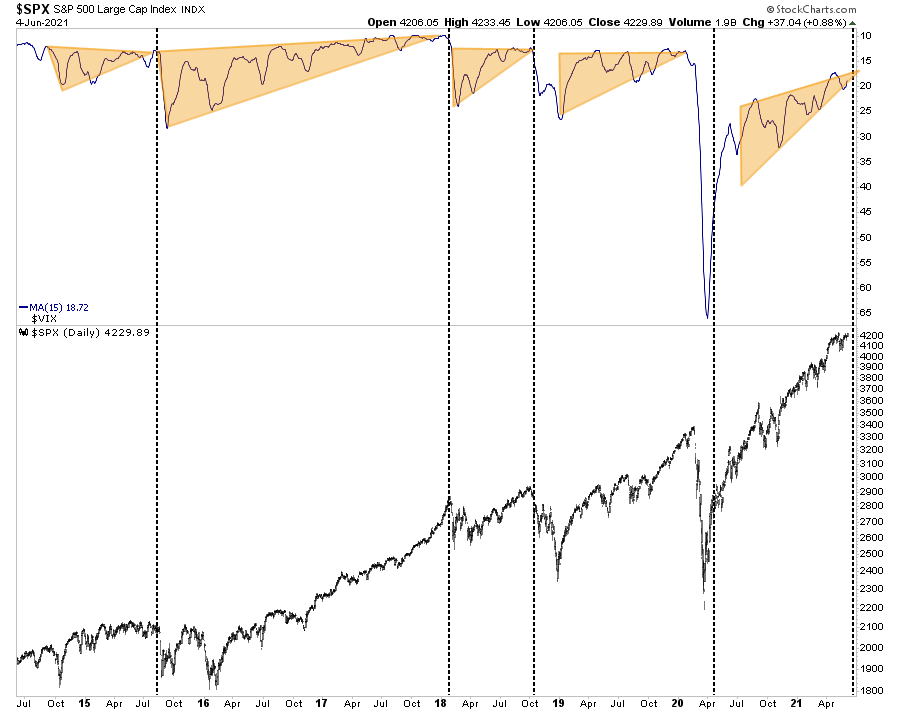
“The market may have one last push higher over the next several weeks. Such will take the VIX even lower and complete the VIX wedge pattern. That pattern has been evident in the last three 10% or greater corrections. By this measure, the correction should begin somewhere around July 21st – August 10th.” – Jim Colquitt
As they say, “timing is everything.” While a July-August time frame is entirely possible, a June-July correction is just as likely. What is essential, as we will discuss momentarily, is understanding that risk is prevalent.
Market Exuberance Stretched Again
It isn’t just complacency that is suggestive of a short-term market correction. There are numerous others as well.
As my friend Daniel Lacalle recently posted, Morgan Stanley‘s market timing indicator is at levels that have typically coincided with market downturns. Just for reference, the current reading is the most “bearish” on record.
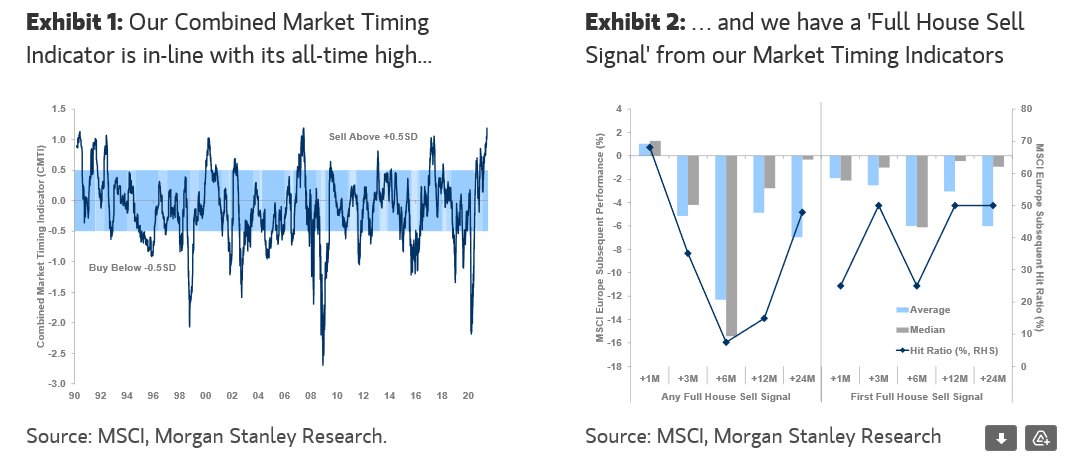
Furthermore, a host of other indicators posted by @Not_Jim_Cramer also suggests there are reasons for concern about a correction.

Inflationary Warning
Lastly, this note from Tom Bowley caught my eye on Saturday.
“The S&P 500 reached a high on Friday of 4233.45, narrowly eclipsing the all-time high close of 4232.60 from May 7th. Unfortunately for the bulls, selling in the final few minutes ruined the breakout attempt. This false breakout, ever so slight, could be quite ominous for next week and there’s one MAJOR reason why. Inflation data.
That May 7th all-time high came just days before the shocking April CPI data was released on May 12th. Now here we are back at the high again. As the late Yogi Berra might say, “it’s deja vu all over again!” I don’t believe inflation to be a problem, but just the possibility of it could trigger scary headlines and encourage selling in the week ahead.” – Tom Bowley, Stockcharts
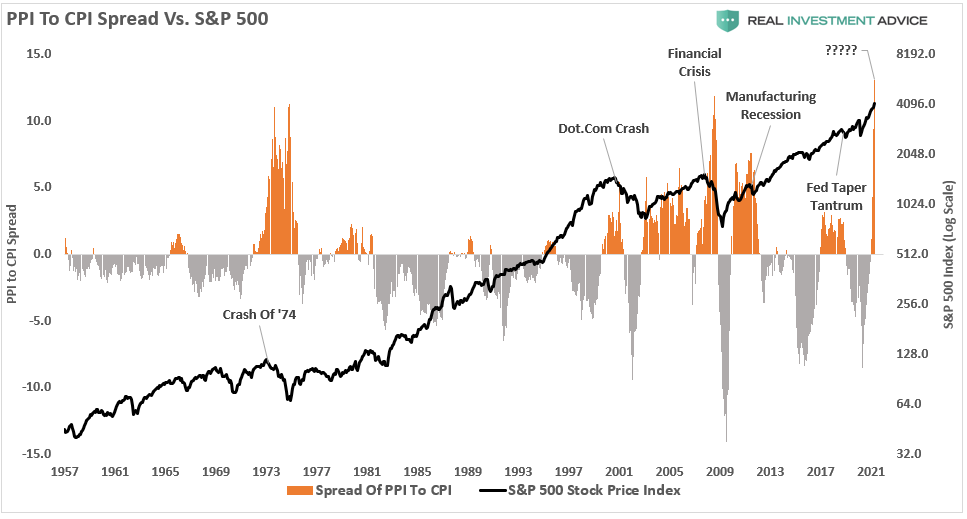
The chart below shows the differential between the annual rates of change of the Producer Price Index (PPI) and the Consumer Price Index (CPI.) It should not be surprising that when PPI surges well ahead of CPI, equity markets tend to run into problems. Such is because this shows producers are unable to pass the inflation along to their customers. Consequently, this leads to reduced earnings and a repricing of risk assets.
Tom goes on to state inflation will not be a problem longer-term correctly. However, in the near term, the surge in inflation will weigh on outlooks, creating corrective actions.
The Problem With Technicals
I want to reiterate a point from the most recent newsletter:
The biggest problem is that technical indicators do not distinguish between a consolidation, a correction, or an outright bear market. As such, if you ignore the signals as they occur, by the time you realize it’s a deep correction, it is too late to do much about it.
Therefore, we must treat each signal with the same respect and adjust risk accordingly. The opportunity costs of doing so are minimal.
If we reduce risk and the market continues to rise, we can increase risk exposures. Yes, we sacrifice some short-term performance. However, if we reduce risk and the market declines sharply, we not only protect capital during the decline but have the liquidity to deploy at lower price levels.

Such is the problem with “buy and hold” strategies. Yes, you will perform in line with the market, but given that you didn’t “sell high,” there is no cash available with which to “buy low” in the future.
With that stated, here is the most significant problem of technical analysis. All of the warnings noted above suggest there is a risk of a correction in the near term. However, technical analysis does not differentiate between a 5% pullback, a 10% correction, or a “bear market.”
You will only find that out once it begins, and such is why risk management is essential.
“Risk management is much like driving a car. If there is a blind spot ahead, and you don’t tap on the brakes to control your speed, you are unlikely to avoid the hazard ahead. Yes, tapping on the brakes to provide more control over the car will slow your arrival time to your destination. However, being late is a much better option than not getting there at all.”
Just A Warning
Again, I am not implying, suggesting, or stating that such signals mean going 100% to cash. What I am suggesting is that when “sell signals” are given, that is the time when individuals should perform some essential portfolio risk management such as:
- Trim back winning positions to original portfolio weights: Investment Rule: Let Winners Run
- Sell positions that simply are not working (if the position was not working in a rising market, it likely won’t in a declining market.) Investment Rule: Cut Losers Short
- Hold the cash raised from these activities until the next buying opportunity occurs. Investment Rule: Buy Low
As stated, there is minimal risk in “risk management.” In the long term, the results of avoiding periods of severe capital loss will outweigh missed short-term gains.
While I agree you can not “time the markets,” you can “manage risk” to improve your long-term outcomes.