


Written by Investing.com Staff, Investing.com
U.S. stocks mixed at close of trade; Dow Jones Industrial Average down 0.87%

U.S. stocks were mixed after the close on Friday, as gains in the Technology, Consumer Services and Industrials sectors led shares higher while losses in the Oil & Gas, Telecoms and Utilities sectors led shares lower.
At the close in NYSE, the Dow Jones Industrial Average lost 0.87%, while the S&P 500 index added 0.16%, and the NASDAQ Composite index climbed 1.14%.
Please share this article – Go to very top of page, right hand side for social media buttons.
The best performers of the session on the Dow Jones Industrial Average were Apple Inc (NASDAQ:AAPL), which rose 2.37% or 2.87 points to trade at 123.86 at the close. Meanwhile, Microsoft Corporation (NASDAQ:MSFT) added 2.24% or 5.12 points to end at 234.11 and UnitedHealth Group Incorporated (NYSE:UNH) was up 1.61% or 5.29 points to 334.16 in late trade.
The worst performers of the session were Salesforce.com Inc (NYSE:CRM), which fell 5.37% or 12.40 points to trade at 218.68 at the close. Dow Inc (NYSE:DOW) declined 2.38% or 1.46 points to end at 59.89 and International Business Machines (NYSE:IBM) was down 2.38% or 2.92 points to 119.55.
The top performers on the S&P 500 were TripAdvisor Inc (NASDAQ:TRIP) which rose 12.65% to 49.05, Alliance Data Systems Corp (NYSE:ADS) which was up 5.70% to settle at 97.04 and L Brands Inc (NYSE:LB) which gained 5.06% to close at 55.01.
The worst performers were Foot Locker Inc (NYSE:FL) which was down 8.21% to 48.40 in late trade, EOG Resources Inc (NYSE:EOG) which lost 7.99% to settle at 64.95 and Universal Health Services Inc (NYSE:UHS) which was down 5.49% to 127.51 at the close.
The top performers on the NASDAQ Composite were Lixte Biotechnology Holdings Inc (NASDAQ:LIXT) which rose 50.66% to 5.68, Ocugen, Inc (NASDAQ:OCGN) which was up 33.62% to settle at 10.6900 and Intrusion Inc (NASDAQ:INTZ) which gained 31.81% to close at 24.74.
The worst performers were Recro Pharm (NASDAQ:REPH) which was down 31.06% to 3.38 in late trade, Tricida Inc (NASDAQ:TCDA) which lost 29.82% to settle at 5.17 and Guardion Health Sciences Inc (NASDAQ:GHSI) which was down 26.02% to 0.5140 at the close.
Falling stocks outnumbered advancing ones on the New York Stock Exchange by 1735 to 1365 and 70 ended unchanged; on the Nasdaq Stock Exchange, 1830 fell and 1360 advanced, while 66 ended unchanged.
Shares in Alliance Data Systems Corp (NYSE:ADS) rose to 52-week highs; gaining 5.70% or 5.23 to 97.04. Shares in L Brands Inc (NYSE:LB) rose to 3-years highs; up 5.06% or 2.65 to 55.01. Shares in Lixte Biotechnology Holdings Inc (NASDAQ:LIXT) rose to all time highs; up 50.66% or 1.91 to 5.68.
The CBOE Volatility Index, which measures the implied volatility of S&P 500 options, was down 6.85% to 26.91.
Gold Futures for April delivery was down 2.72% or 48.35 to $1727.05 a troy ounce. Elsewhere in commodities trading, Crude oil for delivery in April fell 3.04% or 1.93 to hit $61.60 a barrel, while the May Brent oil contract fell 2.51% or 1.66 to trade at $64.45 a barrel.
EUR/USD was down 0.83% to 1.2074, while USD/JPY rose 0.34% to 106.57.
The US Dollar Index Futures was up 0.87% at 90.918.
Dow Snaps 3-Week Win Streak, but Still Ends Feb. Higher as Cyclicals Shine
Australia stocks lower at close of trade; S&P/ASX 200 down 2.35%
The dollar surged Friday, riding on the coattails of the recent surge U.S. Treasury yields amid bets the U.S. will emerge from the crisis stronger than its peers, but the greenback’s momentum is unlikely to last, experts warn.
The U.S. dollar index, which measures the greenback’s strength against a trade-weighted basket of six major currencies, rose 0.87% to 90.91.
Expectations the U.S. economy is likely to emerge from the crisis “better and faster than many other economies” has pushed inflation expectations and the 10-year U.S. Treasury yield sharply higher recently, sparking a move higher in the dollar, Commerzbank (DE:CBKG) said.
Data on Friday, however, showed that fears of runaway inflation could be misplaced as the personal consumption expenditures (PCE) price index, the Federal Reserve preferred measure of inflation, showed price pressures were tepid last month. In the 12 months through January, the PCE price index increased 1.5% from 1.4% in December.
But with another round of fiscal stimulus expected to come, and the Federal Reserve seemingly content to continue its pace of the bond purchases and near-zero interest rates, investors are pricing a further run-up in inflation that could boost prices. Scotia Economics said:
“A round of updates on the US consumer’s financial position offered a glimpse toward what lies ahead in the form of a strong consumer-led rebound driven by massive fiscal stimulus. In the process, evidence of inflationary pressure may well be upon us already.”
Others, however, don’t expect inflation and the knock-on uptick in the dollar to sustain their run higher. Commerzbank added:
“For the second half of the year, we expect inflation expectations and bond yields to fall again somewhat. Then the dollar, which is still benefiting from rising US bond yields, should weaken again.”
See also:
Gold posted its worst monthly loss since 2016 as the yellow metal broke below key mid-$1,700 support on Friday, following most commodities and Wall Street’s Dow lower for a second straight day as investors revalued their portfolios.
Gold for April delivery on New York’s Comex settled down $46.60, or 2.6%, at $1,728.80 per ounce. It earlier tumbled to $1,715.05, its lowest since a June 8 bottom of $1,700.10.
For the week, the benchmark gold futures contract was down 2.7%, following through with the previous week’s slide of 2.5%. With Friday being the last trading session for February, it wrapped the month down 6.6%, its worst since a 7.2% decline in November 2016 .
Spot gold, which reflects real-time trades in bullion, was down $41.03, or 2.3%, to $1,729.81 by 1:50 PM ET (18:50 GMT. Hedge funds and other money managers sometimes rely more on the spot price than futures for determining direction in gold.
Whatever the case, analysts saw deeper losses for the yellow metal until it hit what some called a “hard floor”. Sunil Kumar Dixit of SK Dixit Charting in Kolkata, India, said:
“I don’t rule out on some pull back but I certainly don’t see a big reversal to the $1,835 or $1,900 areas before it hits a hard floor, which can be either the imminent $1,691 level or $1,642. There will be value buying at those levels. Until then, it’s a free fall.”
Gold has suffered a series of setbacks since its futures hit record highs of nearly $2,090 an ounce in August. The decline has accelerated from November, after vaccine breakthroughs for the Covid-19 often raised expectations for economic recovery from the pandemic.
This week’s tumble came after investors worldwide steered away from government bonds and into select assets on conviction that the Covid-19’s stranglehold on the world economy was eroding despite threat from new variants of the virus. The exit from bonds sent yields associated with those instruments surging, pressuring real interest rates to follow.
The 10-year Treasury note, the benchmark for U.S. bonds, surged Thursday to above 1.6%, a level not seen since February 2020, before the outbreak of the pandemic. That triggered a bloodbath on Wall Street, particularly hitting tech stocks index Nasdaq which had gained the most during the pandemic from investors channeling money into so-called stay-home stocks such as video-conferencing tool Zoom and exercise machine Peloton (NASDAQ:PTON).
The slump in stocks continued to an extent on Friday in the broader Dow index, even as Nasdaq put in a partial recovery and the S&P 500, the benchmark for top 500 U.S. stocks, swung in and out of red territory.
Gold, however, no enjoyed no such reprieve.
As the yield on the U.S. 10-year note retreated on Friday, the Dollar Index surged instead to a one-week high of 90.8. The dollar is an outright alternative to gold and typically pressures gold when it rallies.
The Dollar Index, even Bitcoin, have often gained at the expense of gold since early November, assisted by the spike in the 10-year Treasury note. Bond yields have surged numerous times in the last four months as investors bet that inflation and economic growth will surprise in the second half despite the Federal Reserve persistently downplaying expectations on both.
Bitcoin was down as well on Friday, losing 5%. But it also hit record highs above $58,000 recently as it attracted even institutional investors once loyal to gold — despite the U.S. Treasury repeatedly expressing a poor opinion about the granddaddy of cryptocurrencies.
See also:
Crude oil markets rose for a fourth straight month, despite a price drop Friday, intensifying the challenge of keeping up with their phenomenal run as Saudi Arabia and Russia head into a contentious producers meeting next week with different agendas.
The enlarged OPEC+ alliance of oil producers, banding the Saudi-led Organization of Petroleum Exporting Countries with allies steered by Russia, is to meet next Thursday to set output quotas for April. The previous meeting had ended in a face-saving compromise which allowed Russia and Kazakhstan to raise their output, while Saudi Arabia offset the net increase in world supply with a temporary 1 million barrel a day cut of its own.
The kingdom pledged to make these extra curbs only in February and March, but some see signs that could change as the negotiations get underway.
Bloomberg reported earlier this week that Riyadh was publicly urging fellow members to be “extremely cautious,” despite crude prices rebounding to a one-year high. In private, the kingdom has signaled it would prefer that the group broadly holds output steady, delegates said. Moscow, on the other hand, is indicating that it still wants to proceed with a supply increase.
GasBuddy analyst Patrick de Haan said:.
“To stop and potentially reverse slightly the meteoric rise in oil, I’d expect a multi-million barrel increase may be needed to push oil back to $50. With recovering demand, feels like the market probably could use 2+ (million b/d) increase.
“Anything under 1 is too low and risks oil breakout.”
New York-traded West Texas Intermediate, the benchmark for U.S. crude, settled Friday’s trade at $61.50 a barrel, down $2.03, or 3.2%, on the day. But for the week, WTI was up almost 4%. For the month, it was up nearly 18%, extending advances of around 8% in January, 7% in December and 27% in November. At current prices, WTI is also trading at levels last seen in January 2020, before the onset of the coronavirus pandemic that decimated the market for months.
London-traded Brent, the global benchmark for oil, settled at $64.42, down $2.46, or 3.7% on the day. For the week, it was up almost 2.5%. For the month, it was up 15%, extending gains of in January, 9% in December and 27% in November. Brent also hit a 13-month high of $66.81 in February.
A Reuters survey published on Friday forecast that Brent would likely average $59.07 per barrel in 2021. That was up from a Reuters forecast of $54.47 published last month, the biggest monthly revision in that poll going back to at least 2016.
The biggest short-term risk to that Reuters forecast, in the short-term, appears to be that major producers will use soaring prices to relax their pact on output restraint. OPEC+ is currently keeping some 7 million barrels a day of oil off world markets.
Aided by a tighter supply situation in the United States and globally, oil has rallied without a meaningful correction over the past four months. Most technical analysts say the market is overbought. But oil bulls have routinely ignored such warnings, especially after last week’s huge snowstorm in Texas that severely disrupted production in the heartland of U.S. energy.
Prior to the Texas storm, the oil rally was sparked and sustained by a combination of factors.
It began with the November breakthrough in vaccines for the Covid-19. That was followed by OPEC leader Saudi Arabia’s announcement of deeper production cuts in January.
From there on, commodity-index linked buying of oil, sizable weekly drops in U.S. crude stockpiles and hopes for economic stimulus from the Biden administration have spurred gains.
– by Barani Krishnanith additional reporting by Geoffrey Smith
See also:
Natural Gas (Hellenic Shipping News)
Significant demand for natural gas in mid-February led to the second-largest reported withdrawal of natural gas from storage in the United States, according to the U.S. Energy Information Administration’s (EIA) Weekly Natural Gas Storage Report (WNGSR). Weekly stocks fell by 338 billion cubic feet (Bcf) in the week ending February 19, 2021, nearly three times the average withdrawal for mid-February. A record amount of natural gas, 156 Bcf, was withdrawn during that week in the South Central region, which includes Texas.
Colder-than-normal temperatures across much of the Lower 48 states, especially in Texas, led to increased demand for space heating. Population-weighted heating degree days (HDDs) represent temperature deviations lower than 65 degrees Fahrenheit and are weighted based on population distributions across the country. For the week ending February 19, U.S. HDDs reached 254, or nearly 40% colder than normal, according to the National Oceanic and Atmospheric Administration.
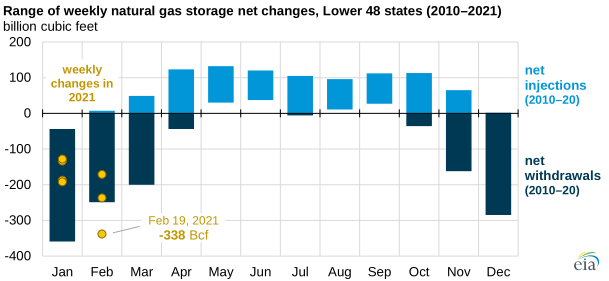
Source: U.S. Energy Information Administration, Weekly Natural Gas Storage Report
In Texas, the two most common space heating fuels are electricity (the primary heating fuel in more than 60% of Texas homes, according to Census data) and natural gas (36%). Increases in electricity demand also affect natural gas demand because natural gas is the most prevalent electricity generation source in Texas and in much of the South.
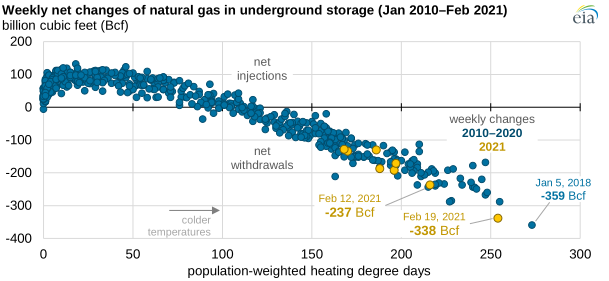
Source: U.S. Energy Information Administration, Weekly Natural Gas Storage Report and heating degree days from National Oceanic and Atmospheric Administration, Climate Prediction Center
Estimated U.S. natural gas demand on February 14, 2021, reached 148.3 Bcf, surpassing the previous single-day record set in January 2019, according to estimates from IHS Markit. In addition, during the week ending February 19, U.S. average weekly dry natural gas production fell by 13.8 billion cubic feet per day (Bcf/d), according to estimates from IHS Markit. The decline in natural gas production was primarily because of freeze-offs, which occur when water and other liquids freeze at the wellhead or in natural gas gathering lines near production activities. Dry natural gas production fell by an estimated 10 Bcf/d in Texas alone, according to IHS Markit estimates.
Source: EIA
.


