Written by Lance Roberts, Clarity Financial
Analysis & Stock Screens Exclusively For RIAPro Members

Please share this article – Go to very top of page, right hand side, for social media buttons.
S&P 500 Tear Sheet
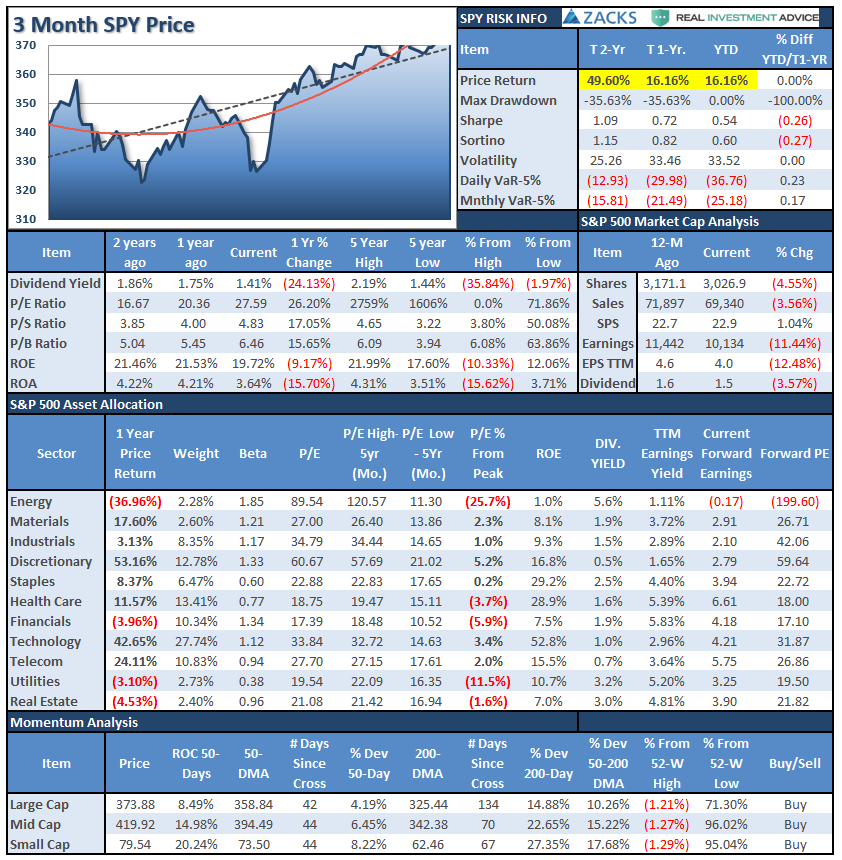
Performance Analysis

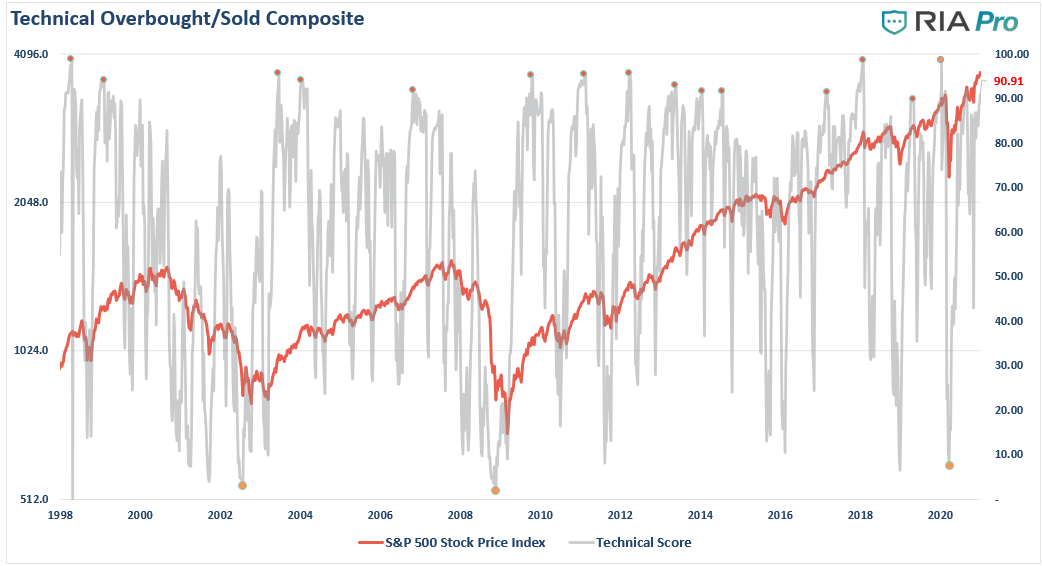
Technical Composite
The technical overbought/sold gauge comprises several price indicators (RSI, Williams %R, etc.), measured using “weekly” closing price data. Readings above “80″ are considered overbought, and below “20″ is oversold.
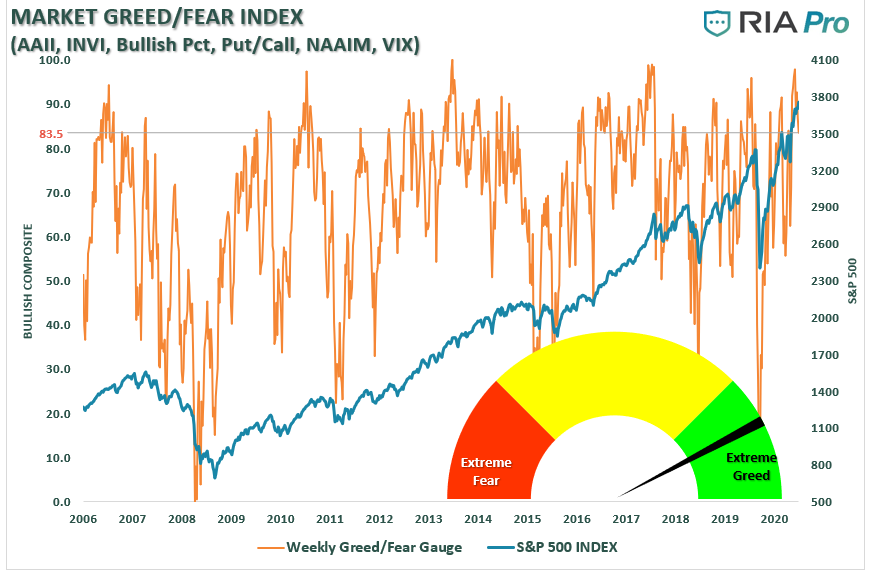
Portfolio Positioning “Fear / Greed” Gauge
The “Fear/Greed” gauge is how individual and professional investors are “positioning” themselves in the market based on their equity exposure. From a contrarian position, the higher the allocation to equities, to more likely the market is closer to a correction than not. The gauge uses weekly closing data.
NOTE: This week, I published the 4-Week Average of the Fear/Greed Index. It is a rarity that it reaches levels above 90. The current reading is 96.07 out of a possible 100.
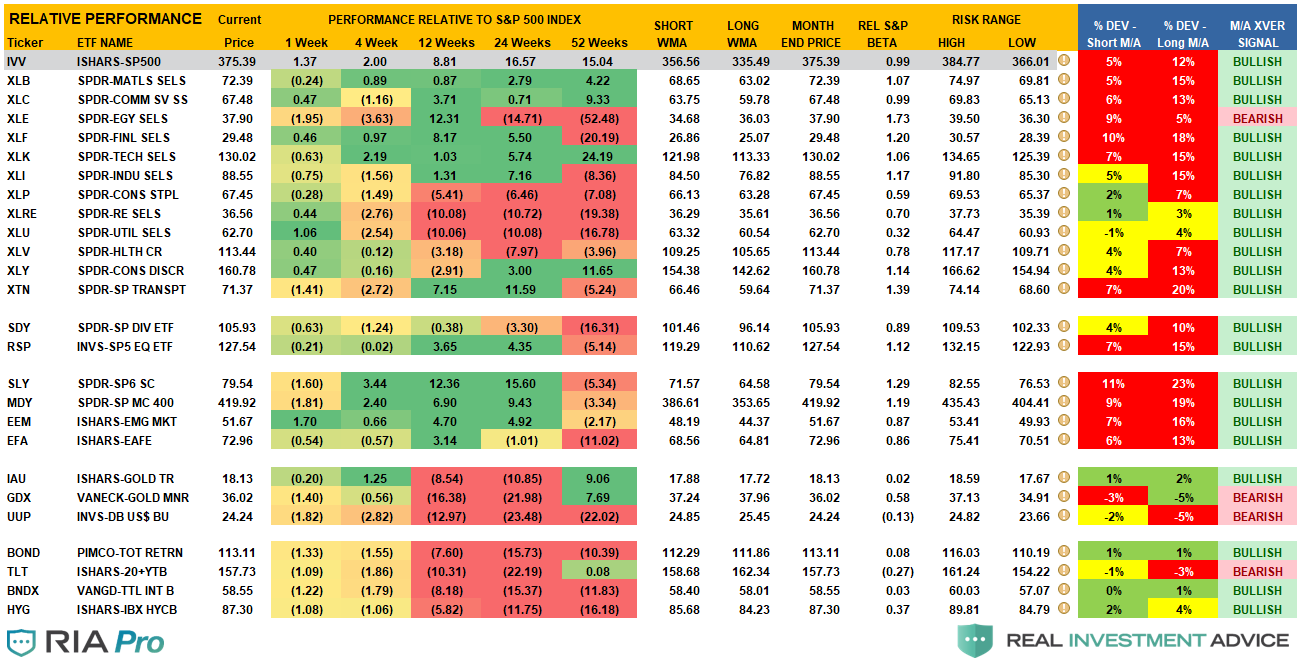
Sector Model Analysis & Risk Ranges
How To Read.
- The table compares each sector and market to the S&P 500 index on relative performance.
- The “MA XVER” is determined by whether the short-term weekly moving average crosses positively or negatively with the long-term weekly moving average.
- The risk range is a function of the month-end closing price and the “beta” of the sector or market.
- The table shows the price deviation above and below the weekly moving averages.
Weekly Stock Screens
Currently, there are 3-different stock screens for you to review. The first is S&P 500 based companies with a “Growth” focus, the second is a “Value” screen on the entire universe of stocks, and the last are stocks that are “Technically” strong and breaking above their respective 50-dma.
We have provided the yield of each security and a Piotroski Score ranking to help you find fundamentally strong companies on each screen. (For more on the Piotroski Score – read this report.)
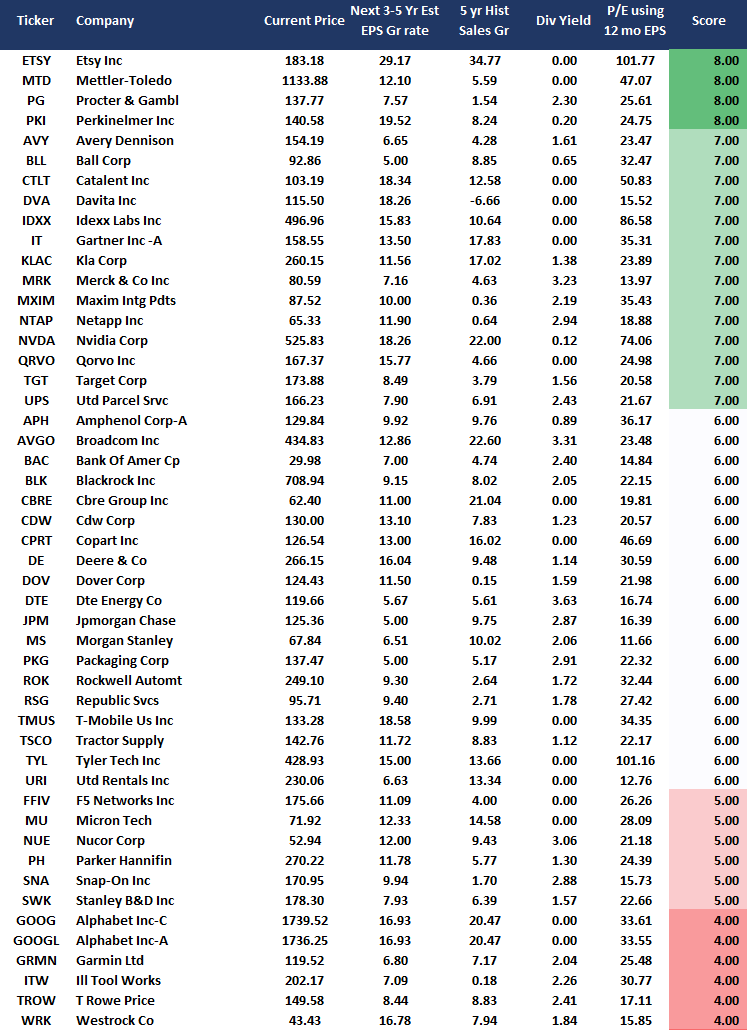
S&P 500 Growth Screen
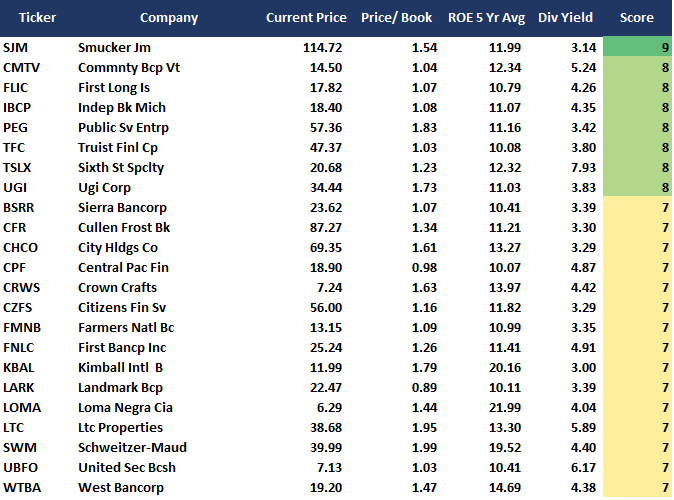
Low P/B, High-Value Score, High Dividend Screen
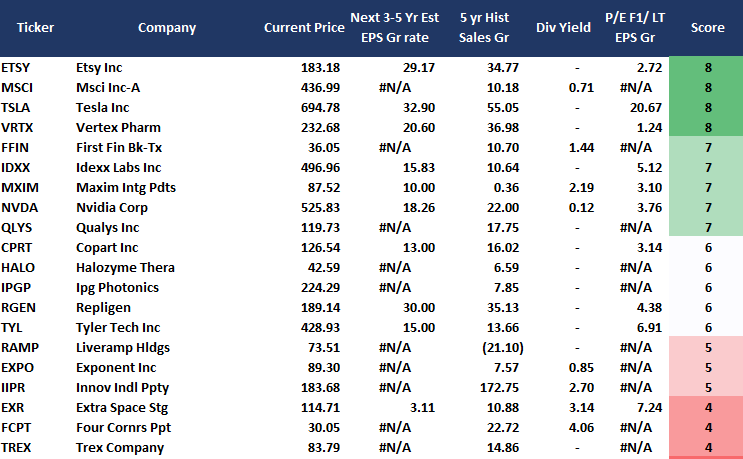
Aggressive Growth Strategy
Portfolio / Client Update
That’s a wrap. It’s done. Stick a fork in it.
Whatever is your favorite saying, the year 2020 is finally over. The best part about 2020 is it won’t take much for 2021 to be a better year.
As we wrap up the year, we have positioned portfolios to take advantage of any bull market continuation. However, we know the potential risks of excess valuations, speculative risk-taking, and a leveraged market.
Therefore, we expect to continue managing risk in 2021 to maintain portfolio performance while reducing volatility and maintaining capital preservation. We have also done extensive work over the last several months modifying our models to absorb the new dynamic of direct stimulus to households. While such may seem to be beneficial in the short-term, the long-run effect of pulling forward consumption has always been negative.
However, between now and then, we will continue to position portfolios to participate in the market. Our focus remains to create returns consistent with your required “hurdle rate” to meet your long-term financial objectives.
Importantly, we look forward to continuing to serve you in the year ahead. We encourage you to reach out with any questions or concerns you have.
Portfolio Changes
During the past week, we made minor changes to portfolios. We post all trades in real-time at RIAPRO.NET.
In anticipation of the seasonally strong period from Christmas to the first two days of January, we added some additional exposure to portfolios.
Increased our S&P Index trade for the year-end “window dressing” run in both models.
- Add 5% SPY bringing total position to 10%.
As always, we are aware of the risks and are carrying tight stops on this position.
Our short-term concern remains the protection of your portfolio. We have now shifted our focus to 2021 and where markets go in the New Year.


