


Written by Lance Roberts, Clarity Financial
Over the last couple of weeks, we have been discussing the ongoing market correction.

As we stated last week:
“As shown in the chart below, we had suggested a correction back to previous market highs was likely but could extend to the 50-dma. So far, the correction has played out much as we anticipated.”
However, we also said:
“However, while we expect a rally next week, due to the short-term oversold condition of the market, there is a downside risk to the 200-dma, which is another 5% lower from current levels. Such would entail a near 14% decline from the peak, which is well within the historical norms of corrections during any given year.”
On Friday, due to the “quad-witching options expiration” (when all options contracts for the current strike month expire and rollover), the market gave up support at the 50-dma, as shown below.
The good news, if you want to call it that, is the market did hold a previous level of minor support and remains oversold short-term.
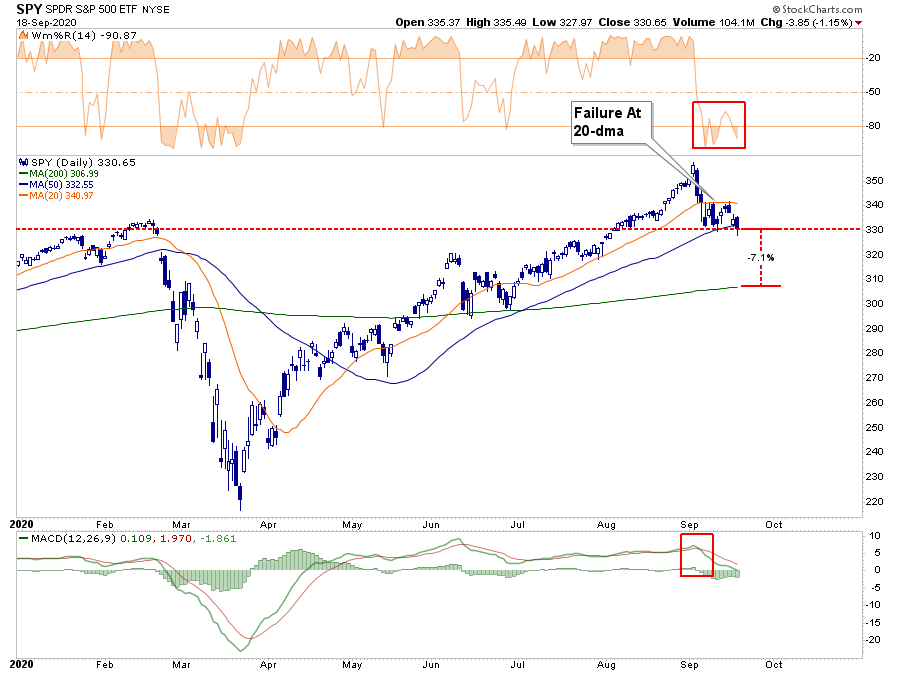
As such, the break of the 50-dma must recover early next week, or it will put the 200-dma into focus. That is currently about 7% lower than where we closed on Friday.
However, as shown below, the markets are very oversold short-term, so a tradeable “bounce” remains very likely in the next few days. If the bounce fails at either the 50- or 20-dma’s overhead, as shown above, such could well confirm an ongoing correction process.
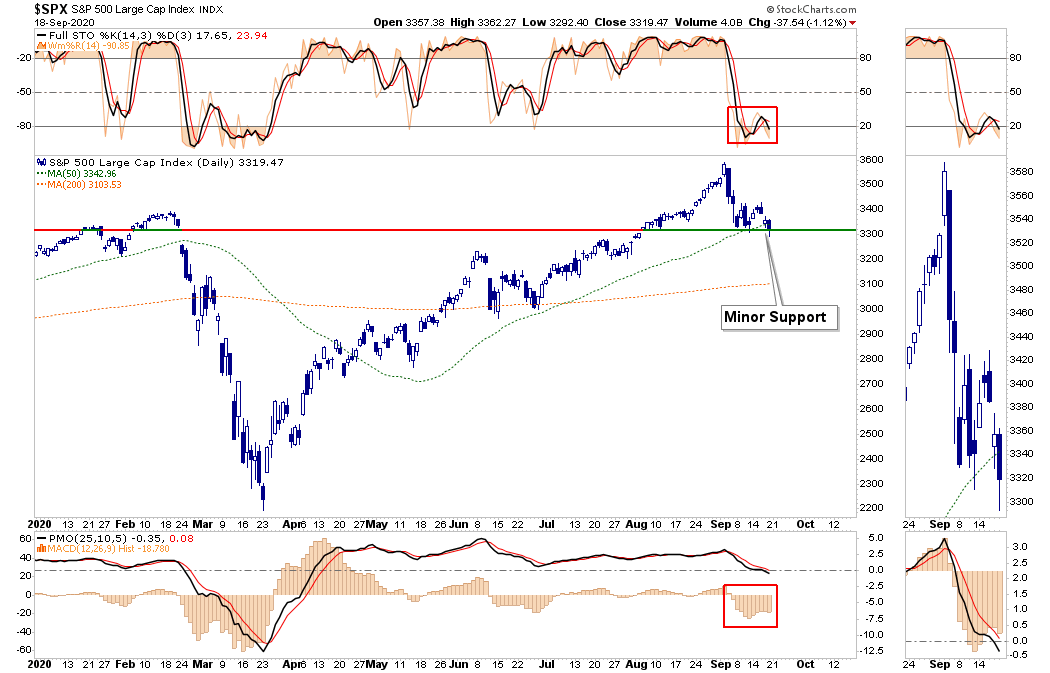
Importantly, as noted previously, this correction was not unexpected and fell in line with historical pre-election market cycles.
Is the correction over? As noted we are likely to get a tradeable bounce next week, but as we will discuss next, there could be more downside pressure in October heading into the election.
Presidential Elections & Market Outcomes
There has been a fair bit of concern about the upcoming election. Given the rampant rhetoric between the right and left, such is not surprising. The Republicans claim that Biden will crash the market. The Democrats suggest the same with President Trump.
From a portfolio management perspective, what we need to understand is what happens during election years to stock markets and investor returns.
“Since 1833, the Dow Jones industrial average has gained an average of 10.4% in the year before a presidential election, and nearly 6%, on average, in the election year. By contrast, the first and second years of a president’s term see average gains of 2.5% and 4.2%, respectively. A notable recent exception to decent election-year returns: 2008, when the Dow sank nearly 34%. (Returns are based on price only and exclude dividends.)” – Kiplinger
The data in the table below varies a bit from Kiplinger as it uses total returns. Since 1833, markets have gained in 35 of those years, with losses in only 11.
Since President Rosevelt’s victory in 1944, there have only been two losses during presidential election years: 2000 and 2008. Those two years corresponded with the “Dot.com Crash” and the “Financial Crisis.” On average, stocks produced their second-best performance in Presidential election years.
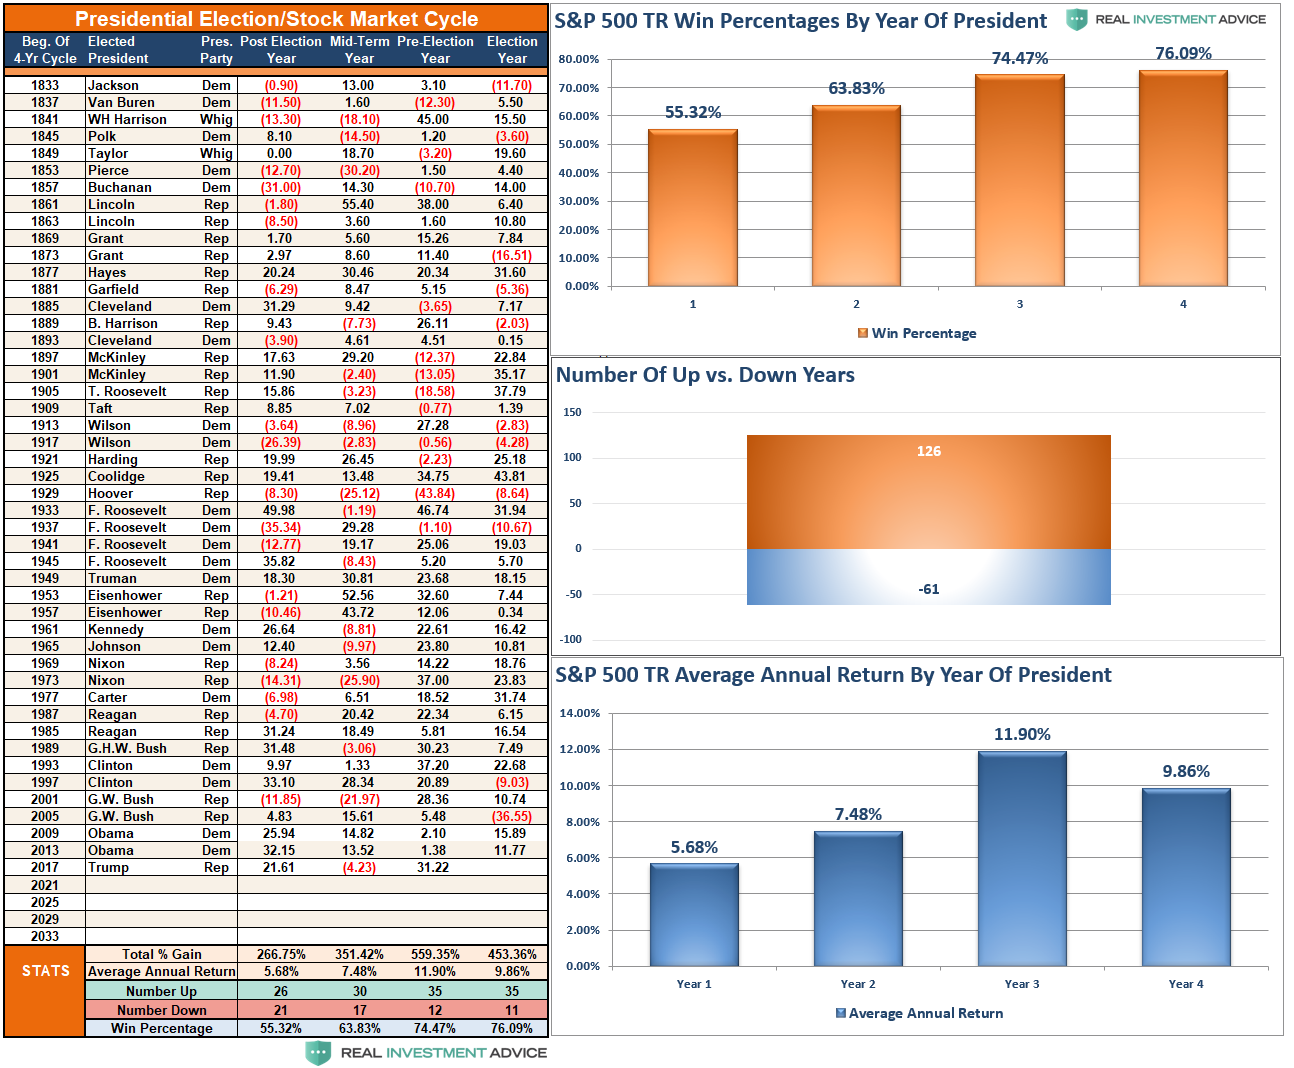
With a “win ratio” of 76%, the odds are high that markets will continue their winning ways. However, I would caution completely dismissing the not so insignificant 24% chance that a bear market could reassert itself, given the current economic weakness.
Furthermore, given the current 12-year duration of the ongoing bull market, the more extreme deviations from long-term means, and ongoing valuation issues, a “Vegas handicapper” might increase those odds a bit.
Will Policies Matter
The short answer is, “Yes.” However, not in the short-term.
Presidential platforms are primarily “advertising” to get your vote. As such, a politician will promise many things that, in hindsight, rarely get accomplished.
Therefore, while there currently much debate about whose policies will be better for the stock market, historically and statistically speaking, it doesn’t matter much.
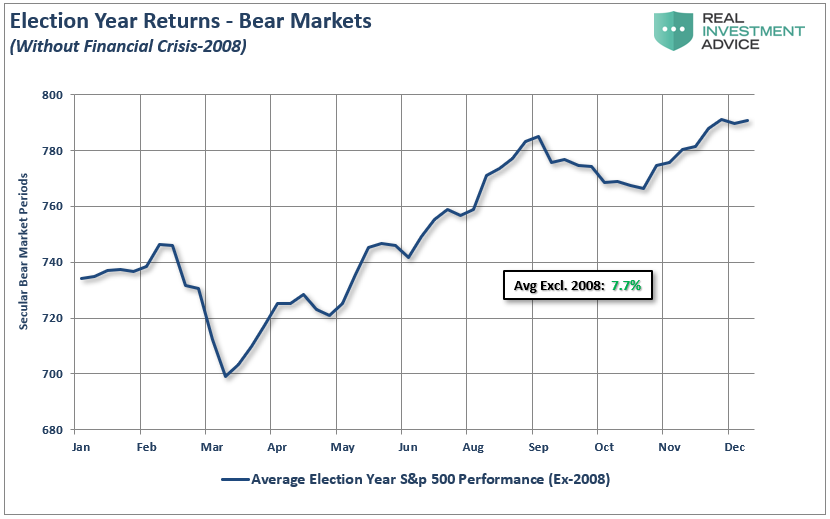
A look back at all election years since 1960 shows an average increase in the market of nearly 2.2% annually.

However, that number is heavily skewed by the decline during the 2008 “Financial Crisis.” If we extract that one year, returns jump to 7.7% annually in election years.
Importantly, note in both cases the slump in returns during September and October. As we stated above, the current market correction falls nicely in line with historical norms.
.


