
by Lance Roberts, Clarity Financial
A couple of weeks ago, I wrote a wildly unpopular article laying out why, if the bulls could push the markets to new all-time highs, the next target would be 3750. With the market now at new all-time highs, and the bulls clearly in charge, is it “safe” for investors to become complacent? Maybe, not.

Please share this article – Go to very top of page, right hand side, for social media buttons.
Technical analysis works well when there are defined “knowns” such as a previous top (resistance) or bottom (support) from which to build analysis. However, when markets break out to new highs, it pretty much becomes a “wild @$$ guess” or “WAG.”
However, we did previously attempt to establish some reasonable targets based on relative “risk/reward ranges“,
“With the markets closing just at all-time highs, we can only guess where the next market peak will be. Therefore, to gauge risk and reward ranges, we have set targets at 3500, 3750, and 4000 or 4.4%, 12.2%, and 19.5%, respectively.”
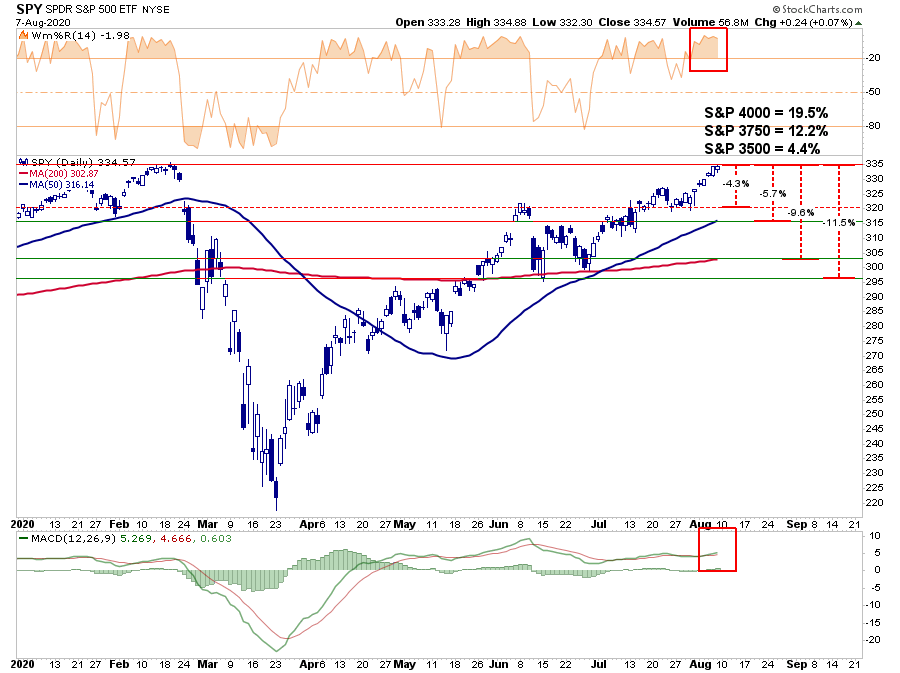
“Given there is no good measure to justify upside potential from a breakout to new highs, you can personally go through a lot of mental exercises. While there is certainly a potential the market could rally 19.9% to 4000, it is also just as reasonable the market could decline 22.2% test the March closing lows.
Just in case you think that can’t happen, just remember no one was expecting a 35% decline in March, either.”
We then delved into establishing a target using the well-established trendlines from the 2009 lows. Given these trendlines have held for over a decade, we can only reasonably assume they will hold in the future. Therefore, since the upper bullish trend line coincides with the February 2020 market peak and the polynomial trend line, 3750 is the next reasonable target.

Markets At Technical Extremes
The markets currently are at historic market extremes. I explain this concept in much more detail in this week’s #Macroview to be posted here Tuesday night.
However, the most critical point of that article is the extreme deviation from long-term means. As noted, trend lines and moving averages tend to act as “gravity.” The further away the market moves from the trendline, the greater the pull becomes.
“Kyōki is the Japanese word for “insanity.” That was the word that came to mind when my co-portfolio manager, Michael Lebowitz, emailed me the following chart.”
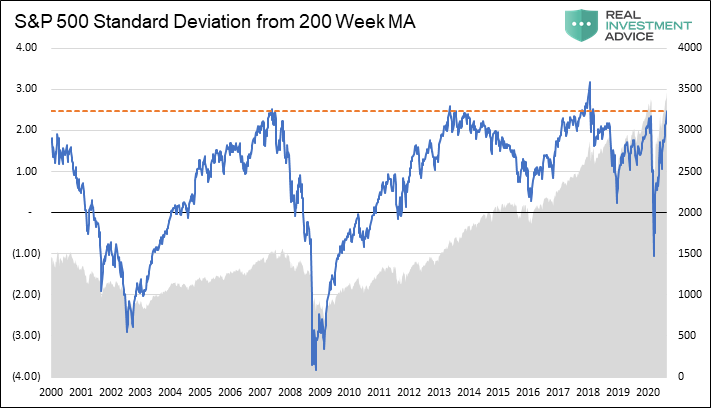
“The chart is WEEKLY data, which smooths out some of the short-term volatility. What is displayed is the standard deviation of the market from its 200-WEEK (4-year) moving average.
Notably, each time of the 5-times previously, going back to 1999, where the market traded at 2-standard deviations or higher from the 4-year moving average, a reversion occurred. Those periods were 2000, 2007, 2014, 2018, February 2020, and now.”
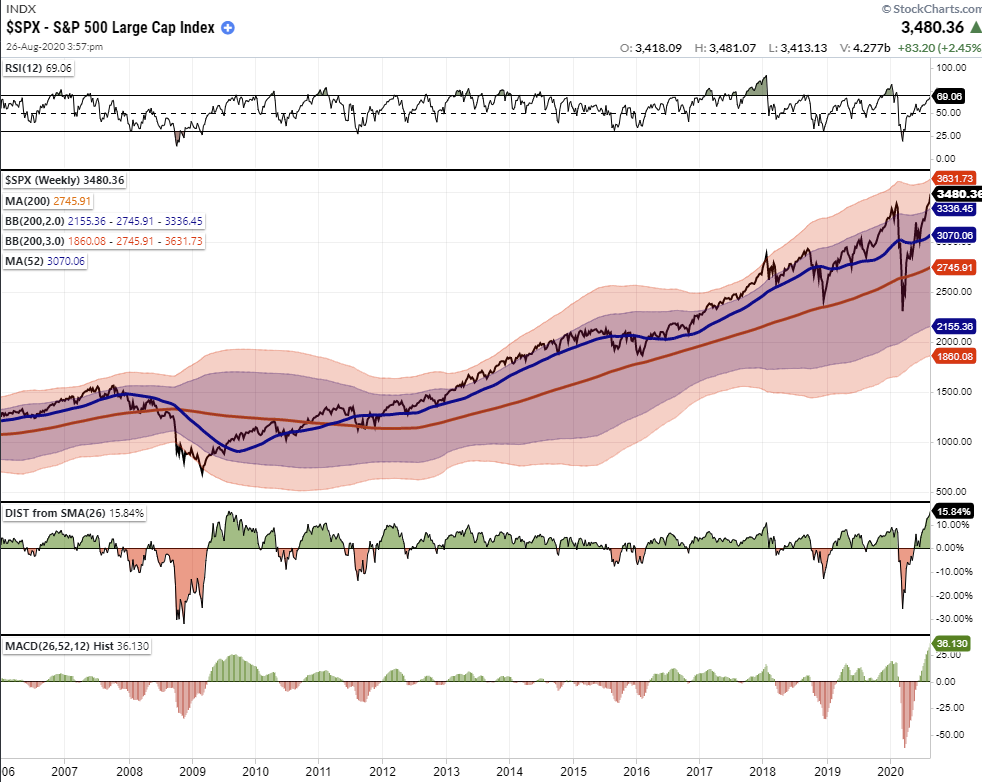
It is remarkable given the economic devastation; the S&P 500 is trading at not only at record highs, but at near-record deviations of the 4-year moving average and MACD readings. Historically, such deviations resolve through a correction or a full-fledged bear market.
Such is just statistical evidence of more extreme positioning by investors in the short-term. As I discussed in “Revisiting Bob Farrell’s 10 Investing Rules“:
“Like a rubber band that has been stretched too far – it must be relaxed in order to be stretched again. This is exactly the same for stock prices that are anchored to their moving averages. Trends that get overextended in one direction, or another, always return to their long-term average. Even during a strong uptrend or strong downtrend, prices often move back (revert) to a long-term moving average.”
More Signs Of Exuberance
While prices are clearly at historic extremes on many levels, we continue to see more numerous indicators showing extreme signs of “exuberance” in the markets.
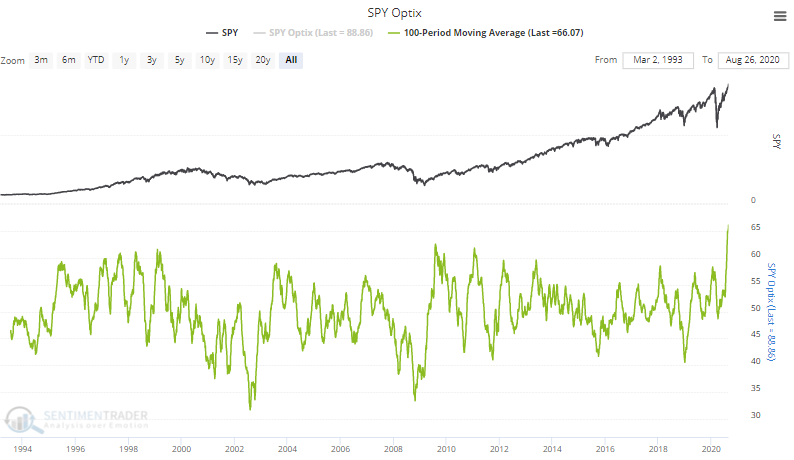
This tweet from Sentiment Trader summed it up best.

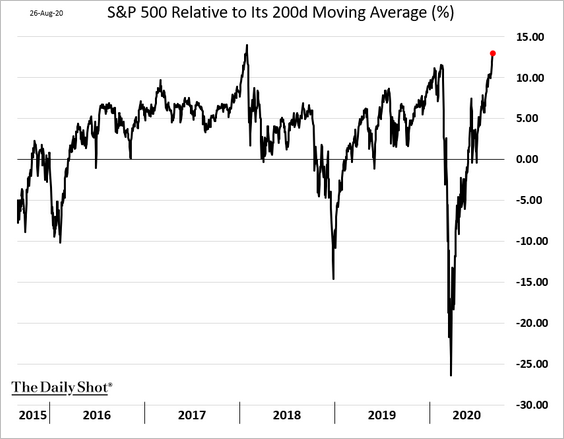
As noted in the weekly charts above, the S&P is also trading at extreme levels above its shorter-term daily moving averages as well.
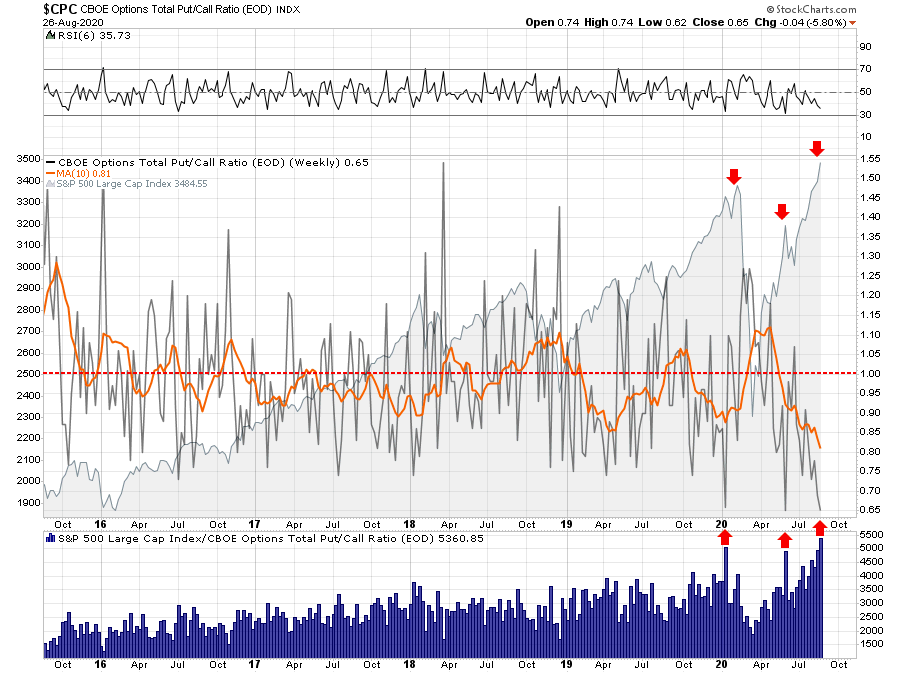
With “shorts” now at historically levels, market participants have given up hedging portfolios against a correction. Historically low put/call ratios have always coincided with short-term corrections or worse. It is one of the lowest levels since the peak of the market in 1999.
The stock/bond ratio has also reached levels more normally consistent with short-term market peaks and corrective actions.
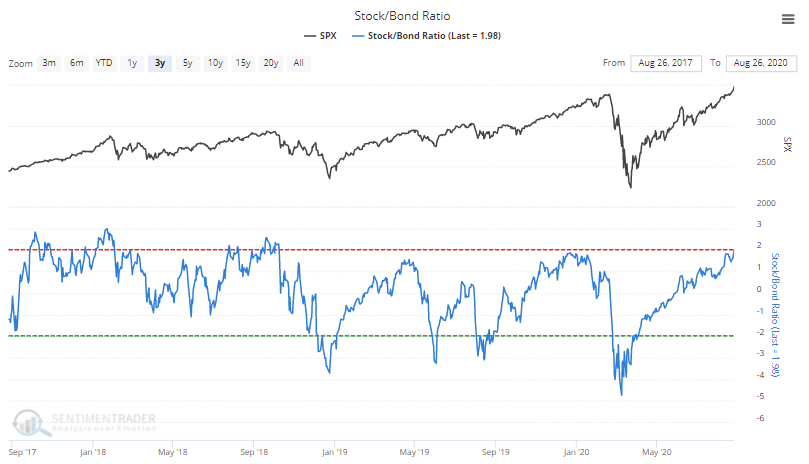
The rise in the stock/bond ratio is not surprising, given the level of exuberance by retail investors.
None of this data means the market is about to crash.
What it does mean, as we discussed last week in “Winter Approaches,” is that a correction of 5-10% has become increasingly likely over the next few weeks to two months. While a 5-10% correction may not seem like much, it will feel much worse due to the high level of complacency by investors currently.
All of the data suggests that “Winter Is Coming.” Therefore, this is why we are adding “value” to our portfolios to prepare for colder weather.


