by UPFINA
Software Ate The World: Now What?
The popular model on Wall Street is an asset light business which utilizes software. At first glance, you might be confused about why an investor would want less assets as you thought assets were a good thing. It’s like how a company wants to show less profits to pay less taxes in that it’s the opposite of what you’d expect.

Please share this article – Go to very top of page, right hand side, for social media buttons.
Asset light models are advantageous because they don’t take large investments. If a company needs to maintain large assets, it’s a problem if the business shifts. Imagine if a company spent a lot of money on a new widget which became useless after a few quarters (quicker than expected). Investors like a nimble business. The company needs to have a deep moat because if the business is asset light, it’s easy for start ups to get involved and compete.

On the balance sheet, software is classified as an intangible asset because it’s not physical. Other examples of intangible assets are brand recognition, goodwill, and patents. Investors sometimes frown on goodwill. That’s because it’s a miscellaneous bucket that’s the vaguest. A terrible acquisition can be put as goodwill on the balance sheet when it really should be written off. As you can see from the chart above, in the past 28 years, the percentage of assets on the balance sheet that are intangible has increased from just under 20% to 40% as software took over the world. Many companies outside of tech are utilizing software. It can even be a competitive advantage for them.
Tech Bubble 2.0?
The definition of a bubble is very unclear. We will say it’s when an asset has a high valuation and subsequently falls 30% or more without a major negative catalyst. The 2020 bear market correction of 34% isn’t widely considered to be a bubble burst because the COVID-19 crisis caused it. Bitcoin in the late 2010s, technology stocks in the late 1990s, housing in the late 2000s, and fracking in the mid-2010s are generally considered bubbles.
Source: RBC Capital Markets
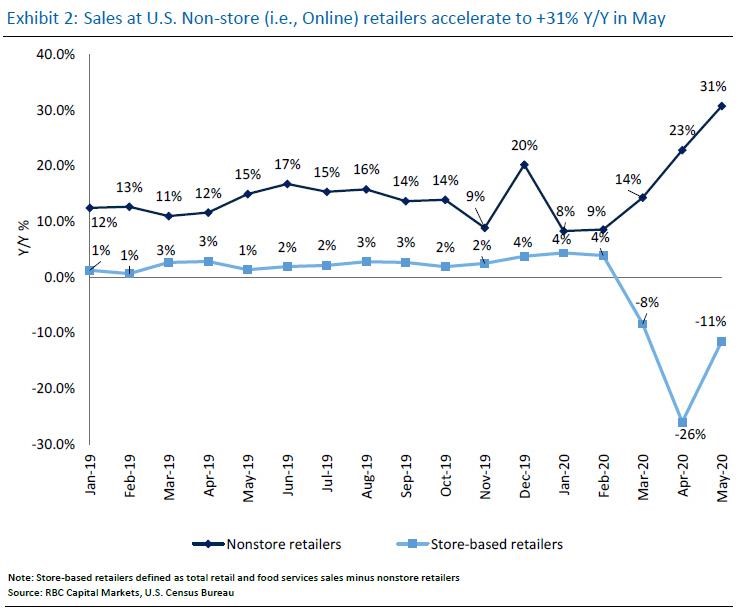
We’re not saying technology is in a bubble now because we don’t make predictions, but the valuations are objectively high. The Nasdaq is on an 8 day winning streak, so it’s no surprise things have gotten stretched. Let’s look at how extended valuations have become because this isn’t just about this recent streak. The work from home stocks and the online shopping stocks are pulling forward years of growth as they are having years of gains in a few months. That’s not to say these firms aren’t actually doing well. As you can see from the chart above, online sales growth has accelerated to 31%. The question is how sustainable this growth is.
As you can see from the chart below, Fastly, the work from home stock, has a 29.43 price to sales ratio which is just below Microsoft’s peak in 2000 and a bit further below Cisco’s peak. Shopify beats them all as it has a nearly 60 price to sales multiple. We’d be remiss if we didn’t mention that Tesla now has a larger market cap than Toyota, making it the largest car company in the world. Tesla’s higher valuation is generally attributed to its technology.

FAAMNG Takeover
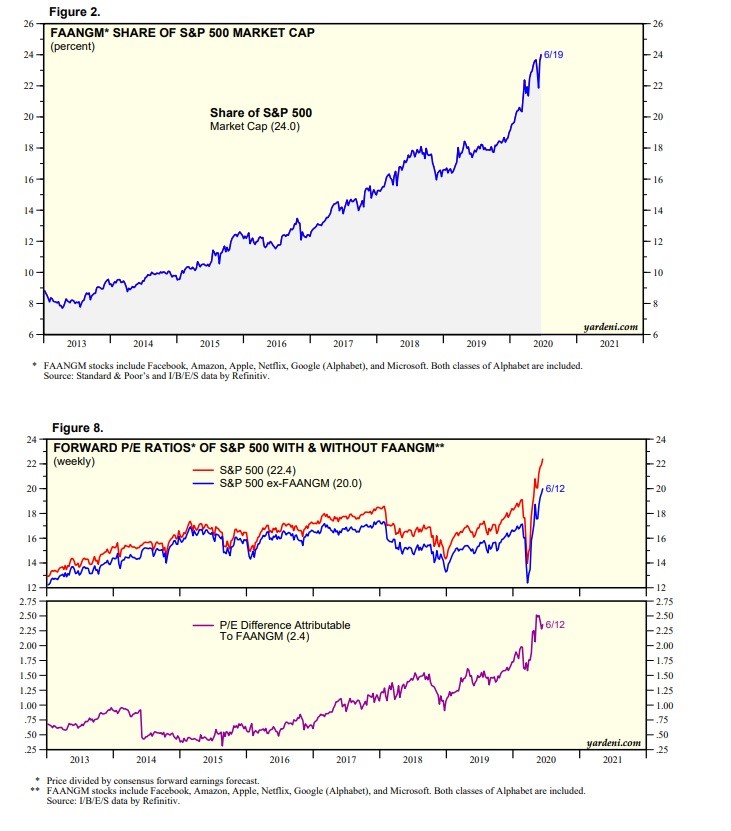
It’s official, the FAAMNG stocks, which are Facebook, Apple, Amazon, Microsoft, Netflix, and Alphabet, have taken over the U.S. stock market. As you can see from the top chart below, the group is 24% of the index. That percentage has tripled since 2013. It is about impossible for such a tripling to occur again in the next 7 years. The biggest risk these firms face is regulations especially if the Democrats win the 2020 election.
Source: Yardeni
These tech stocks are pushing the overall market’s multiple higher. That’s’ why you can still find value even with the S&P 500 having a relatively high PE multiple. Composition catalyzes big changes to the market multiple. When the banks and energy do well, the multiple is low and when tech and healthcare do well, the multiple rises. With the race for a COVID-19 cure occurring, the biotech sector is at a record high. As you can see from the bottom chart above, the S&P 500 with the big internet names has a PE ratio of 22.4. Without them, it is a more manageable 20. This 2.4 gap is much higher than the about -0.25 gap in 2013. The gain in share in the past 7 years has been caused by profit outperformance and multiple expansion. With these stocks already more expensive than the market, it gives them less room to outperform.
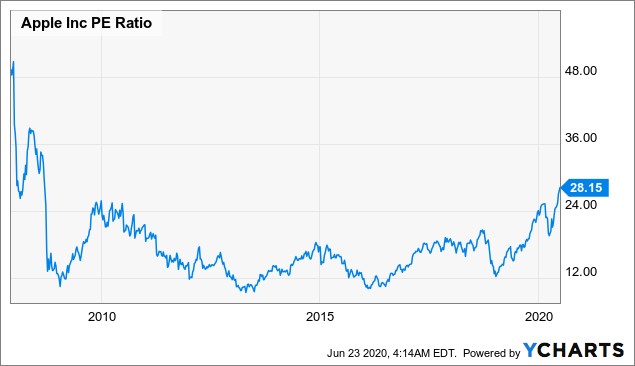
As you can see from the chart below, Apple is unusually expensive as it has a PE ratio of 28.15 which hasn’t been reached since late 2007. Apple is getting more expensive because its services business is more sustainable than hardware sales which are cyclical. NVIDIA is also unusually expensive as it has a 20 PS ratio which it hasn’t previously reached in its 20 year history.
Source: YCharts
Where Is The Value?
Given this huge rally in technology and biotech stocks, it’s no surprise the growth factor is elevated. The chart below shows Morgan Stanley’s composites for growth, momentum, and quality are 100, 85, and 99. Growth and quality stocks have never been more expensive going back to 1990. Value has never been cheaper as its index is at 0. The rally boosted by the Fed since the March bottom has created extremely expensive valuations in growth stocks that are consistent with bubbles. We won’t predict what happens next.

Conclusion
More companies have intangible assets on their balance sheets because software is intangible. Fastly and Shopify’s average price to sales ratio is higher than the average of Microsoft and Cisco’s at the peak of the tech bubble in 2000. FAAMNG are 24% of the S&P 500; they push its PE multiple up 2.4 points to 22.4. Apple has its highest PE multiple since late 2007 and NVIDIA has its highest price to sales multiple ever. According to Morgan Stanley, quality and growth stocks have never been more overvalued and value stocks have never been cheaper.
.


