Written by Lance Roberts, Clarity Financial
There are several measures of optimism we can look at which have historically corresponded with short-term market peaks and corrections.

Please share this article – Go to very top of page, right hand side, for social media buttons.
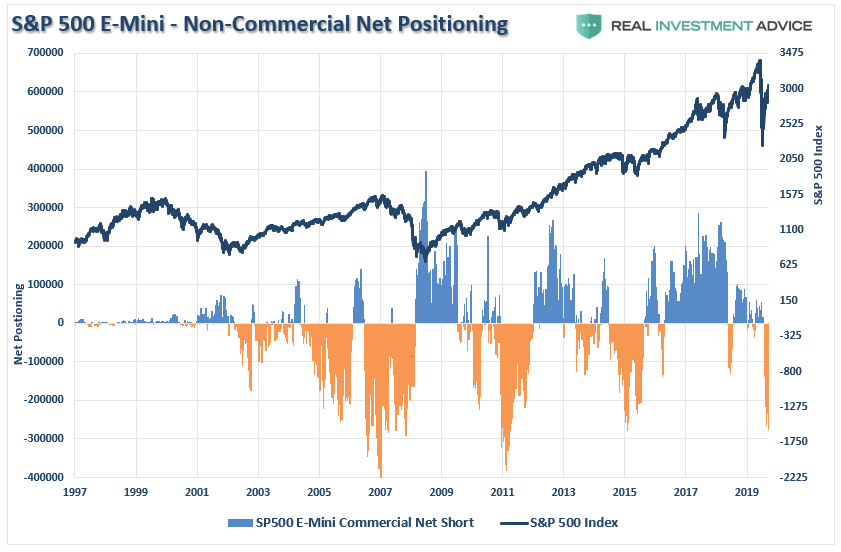
Currently, non-commercial speculators are carrying the one of the largest net-short positions on the S&P 500 in recent history. While such positioning doesn’t necessarily mean the market will crash, it has historically aligned with short-term peaks and bear markets.
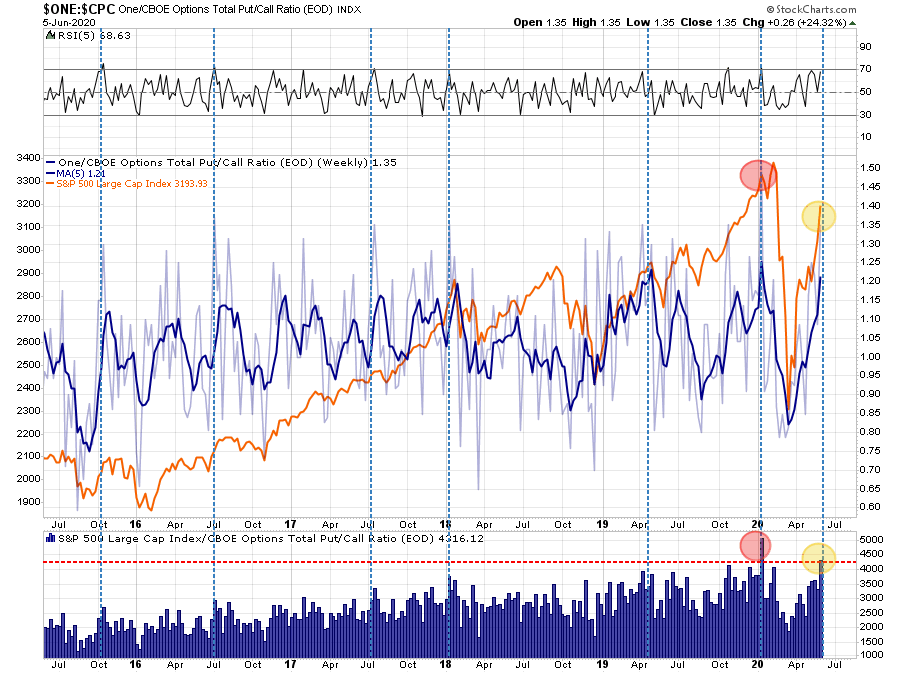
The total put-call ratio all suggests similar positioning. With investors getting extremely aggressive by buying call options, the ratio is back to more extreme elevations. The last time the put-call ratio was this elevated was in January.
The issue at hand is the markets have priced in a “V-shaped” recovery which is well ahead of what the economic data suggests. Such was seen in Friday’s employment report fiasco.
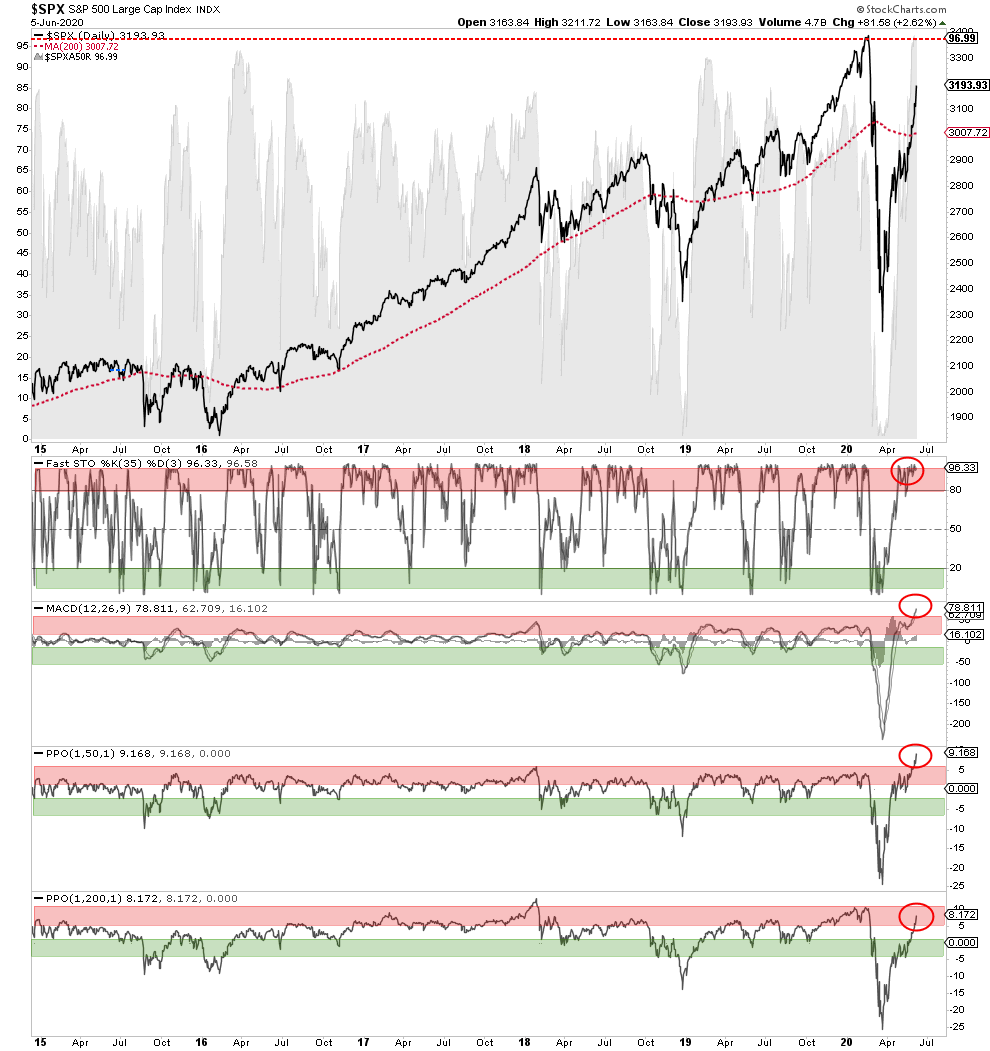
Technical Review Of The Market
Regardless, the markets are bullish biased and we must be respectful of that reality. As noted in last week’s report:
“No matter how you want to slice the data, the markets are back to more egregious overbought conditions on a short-term basis.”
The break above the 200-dma set the bulls in motion and triggered a parabolic advance in the market over the last week. Given the market is now pushing a 3-standard deviation move to the upside, with indicators very overbought, a short-term corrective action is likely. (Note the market was just 3-standard deviations BELOW the 50-dma in March.)
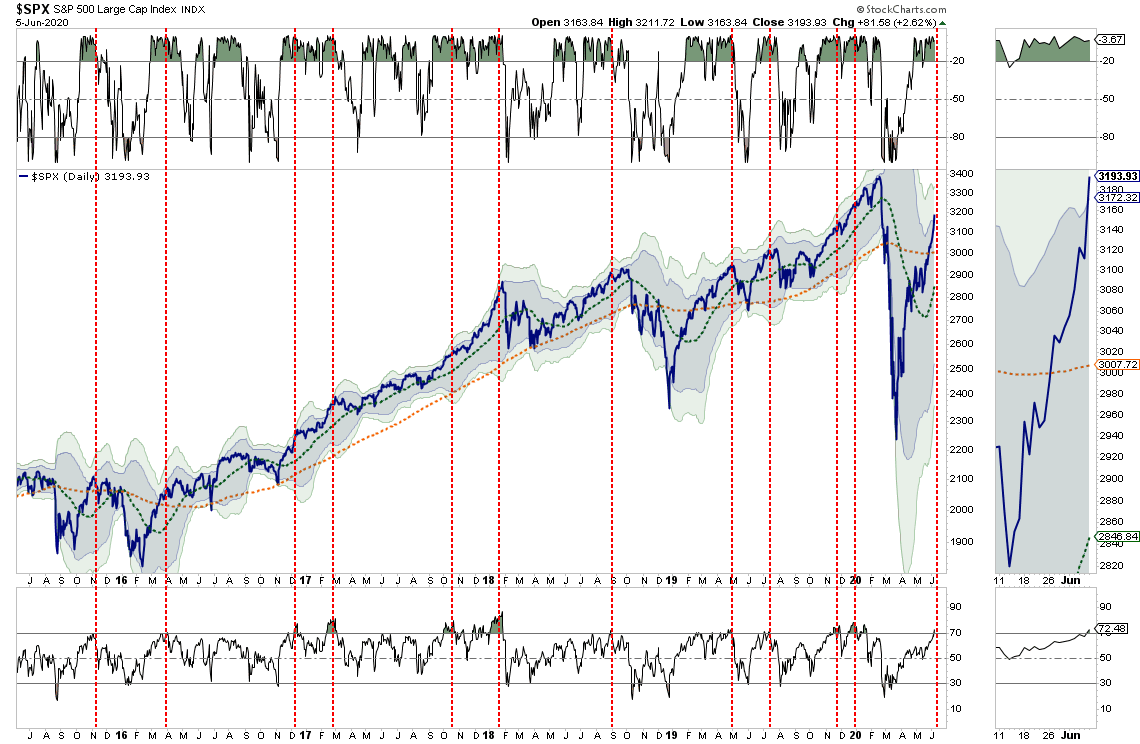
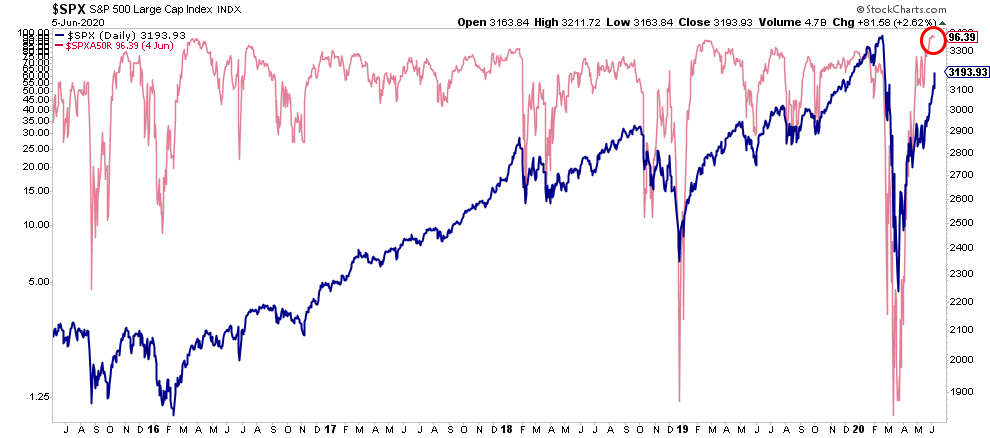
Also, as noted previously, with 95% of stocks now trading above the 50-dma, such has historically signaled short-term corrections to resolve the overbought conditions. Currently, while the market has been rising, the number of stocks above their 50-dma has stalled at one of the highest levels in a decade. Watch for a deterioration in the percentage to signal an upcoming correction.
Lastly, all of the overbought/sold indicators have aligned, along with the vast majority of stocks being above the 50-dma. As noted by the red circles below, every measure is in, or exceeding, historical overbought conditions. Such also suggests a correction is likely in the short-term which will provide a better opportunity to increase exposure accordingly.
The Recovery Trade
Lastly, the market has rallied over the past week on “better than expected” economic data which supports hope of a “V-shaped” economic recovery. However, as noted by the Citi Economic Surprise Index, that is likely to change over the next month as data begins to disappoint. Peaks in the surprise index have coincided with short-term corrections, or more, in the market.
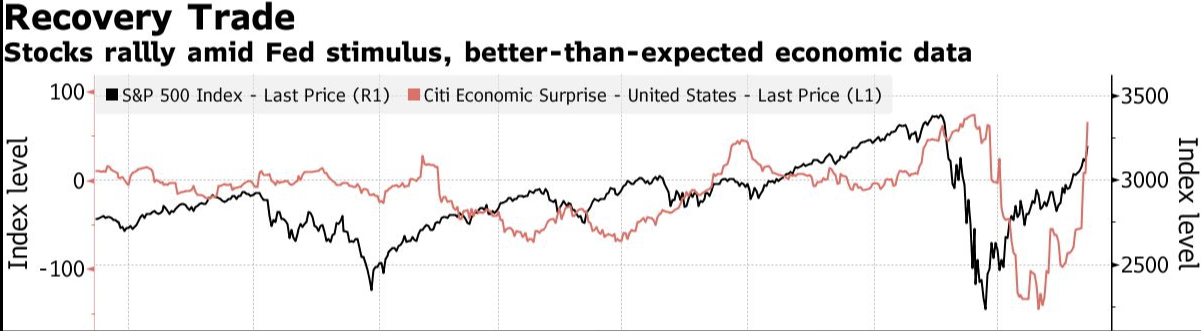
With “coronavirus cases” likely to rise sharply following Memorial Day celebrations and recent crowded protests, the risk of disappointment has risen.
This has been an exceptionally rally. All of our equity positions are now extremely stretched and overbought. Conversely, all of our hedges VERY oversold.
Caution is advised.
Updating Risk Ranges
As I wrote previously, the break above the 200-dma had changed the complexion of the market.
“If the markets can break above the 200-dma, and maintain that level, it would suggest the bull market is back in play. Such would change the focus from a retest of previous support to a push back to all-time highs.
While such would be hard to believe, given the economic devastation currently at hand, technically, it would suggest the decline in March was only a ‘correction’ and not the beginning of a ‘bear market.'”
The rally this past week now confirms the selloff in March was a “correction” and not a “bear market.” Such has important considerations in allocation models and portfolio positioning.
In corrections, recoveries back to previous highs are the norm as the bullish trend of the market continues. During bear markets, expect rallies to fail and price trends to change to negative. While it certainly seemed that was the case in March, given the severity of the decline, the rapid recovery has changed the narrative.
However, even as we update the risk/reward trading ranges, the probabilities still remain negative. With the market very overbought short-term (orange indicator in the background), downside risk outweighs the upside return in the short-term.
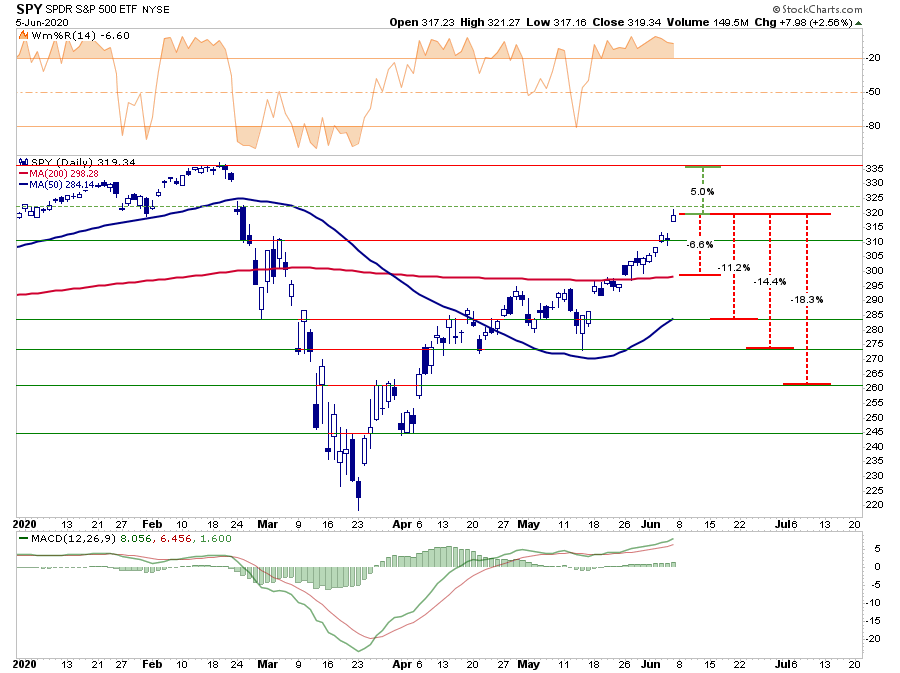
With the S&P 500 is now only 5% from all-time highs, all measures are now based against that advance. A breakout to all-time highs, should such occur, will reset all parameters. We have assigned probabilities to pullback ranges short-term.
- -6.6% to the 200-dma vs. +5% to all-time highs. Negative (70% probability)
- -11.2% to the 50-dma vs. +5% to all-time highs. Negative (20%)
- -14.4% to previous consolidation lows vs. +5% to all-time highs. Negative (5%)
- -18.3% to March bounce peak vs. +5% to all-time highs. Negative (5%)


