by Lance Roberts, Clarity Financial
Last week was a pretty stunning time in the market. Over the span of 5 days, the market declined an astonishing, or should I say breathtaking, 15%.

Please share this article – Go to very top of page, right hand side, for social media buttons.
The last time we saw a one week decline of that magnitude was during the “Lehman” crisis. (Of course, with hedge funds blowing up all week, this is precisely what the Fed has been bailing out.)
Since the peak of the market at the end of February, the market is now down a whopping 32%.

Surely, we are close to a bottom?
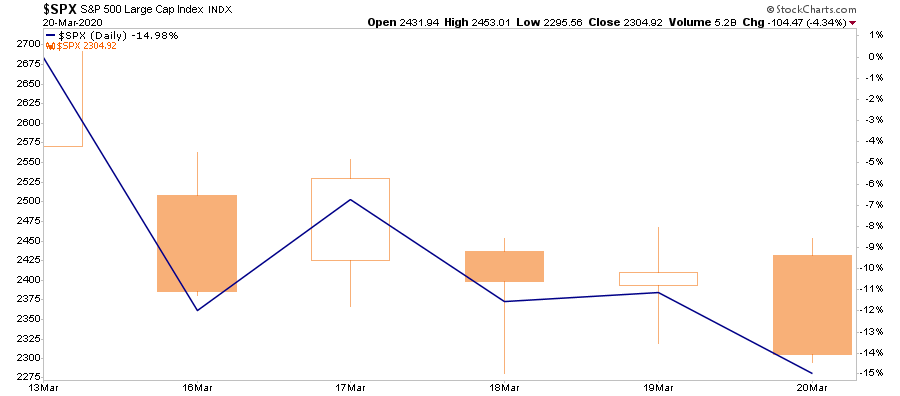
Let’s revisit our daily and weekly charts for some clues as to where we are, what could happen next, and what actions to take.
On a daily basis, the market is extremely stretched and deviated to the downside. Friday’s selloff smacked of an “Oriental Rug Company” where it was an “Everything Must Go Liquidation Event.”
Remember all those headlines from early this year:
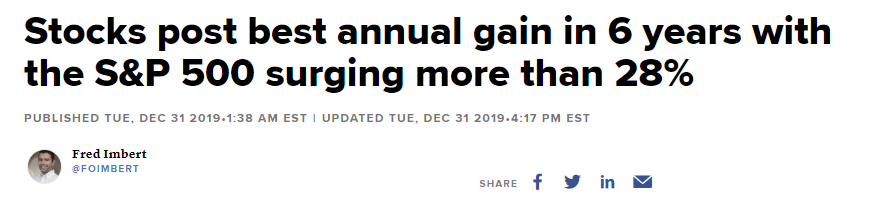
Well….
This selloff completely reversed the entire advance from the 2018 lows. That’s the bad news.
The good news is the markets are now more extremely oversold on a variety of measures than at just about any other point in history.
Such a reversal, particularly given the “speed and magnitude” of the decline, argues for a “reversal” of some sort.
Warning: Any reversal will NOT BE the bear market bottom. It will be a “bear market” rally you will want to “sell” into. The reason is there are still many investors trapped in “buy and hold” and “passive indexing” strategies which are actively seeking an exit. Any rallies will be met with redemptions.
As noted above, bear markets do not end with investors wanting to “buy” the market. They end when “everyone wants to sell.”
And, NO, investors are “not different this time.”
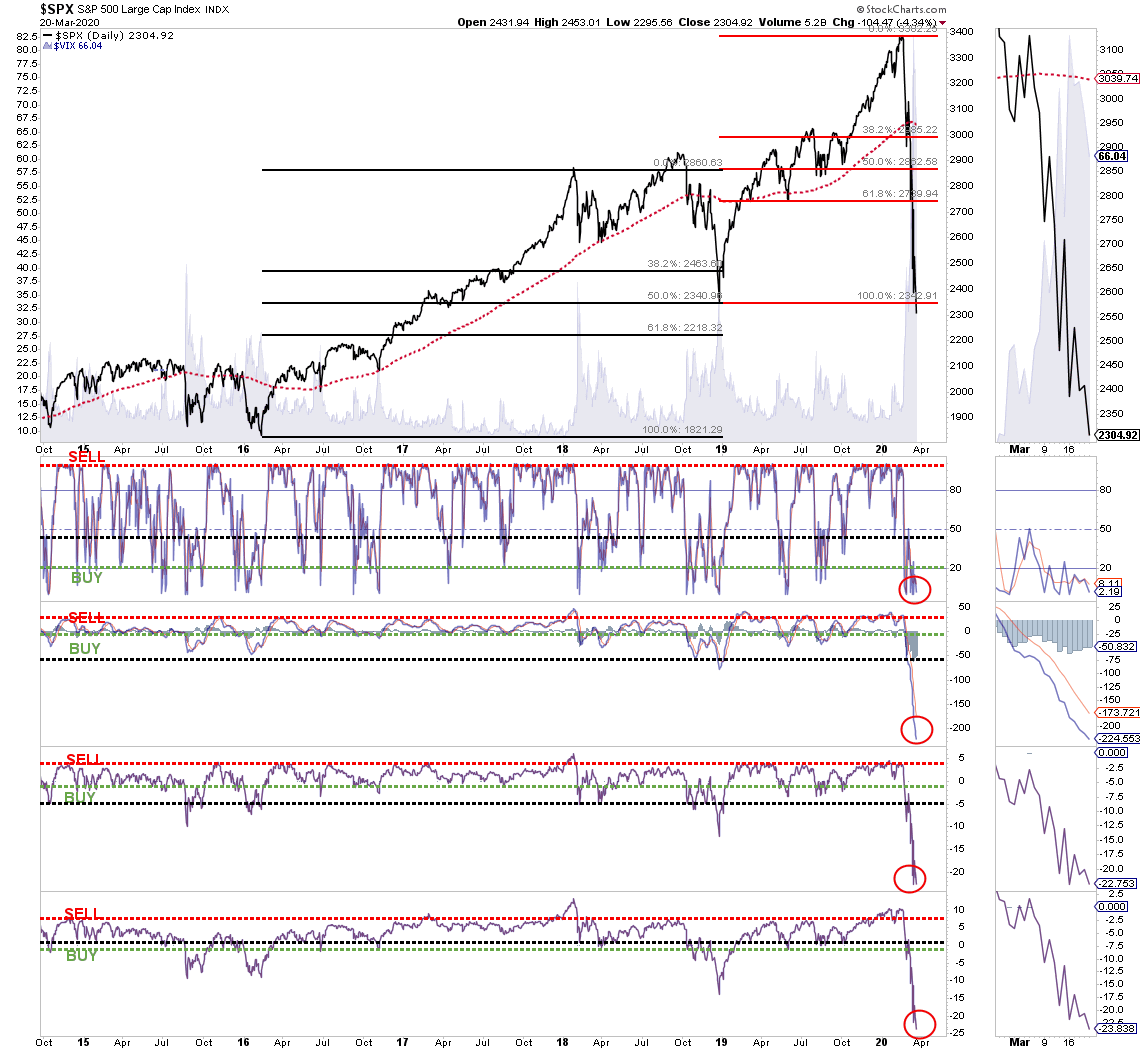
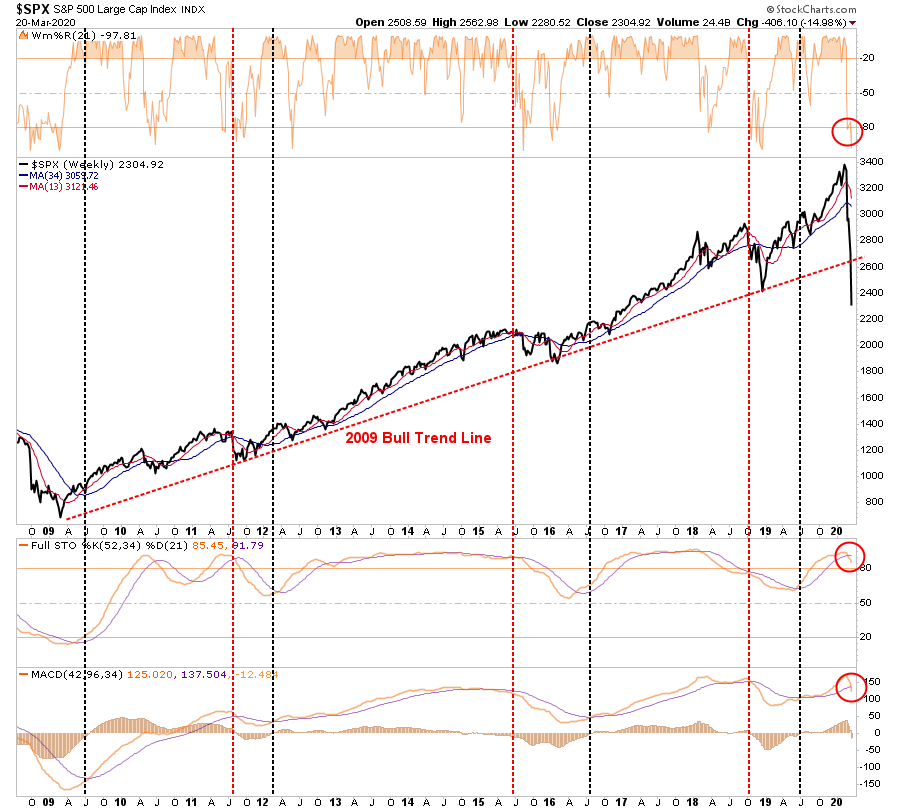
This “bear market” rally scenario becomes more evident when we view our longer-term weekly “sell signals.” As we warned last week:
“With all of our signals now triggered from fairly high levels, it suggests the current selloff is not over as of yet. In other words, we will see a rally, followed by a secondary failure to lower lows, before the ultimate bottom is put in.”
Unfortunately, we have yet to see any attempt at a sustained rally.
More importantly, with the failure of the markets to hold lows this week, both of our long-term weekly “sell signals” have now been triggered. Such would suggest that a rally back to the “bullish trend line” from 2009 will likely be the best opportunity to “sell” before the “bear market” finds its final low.
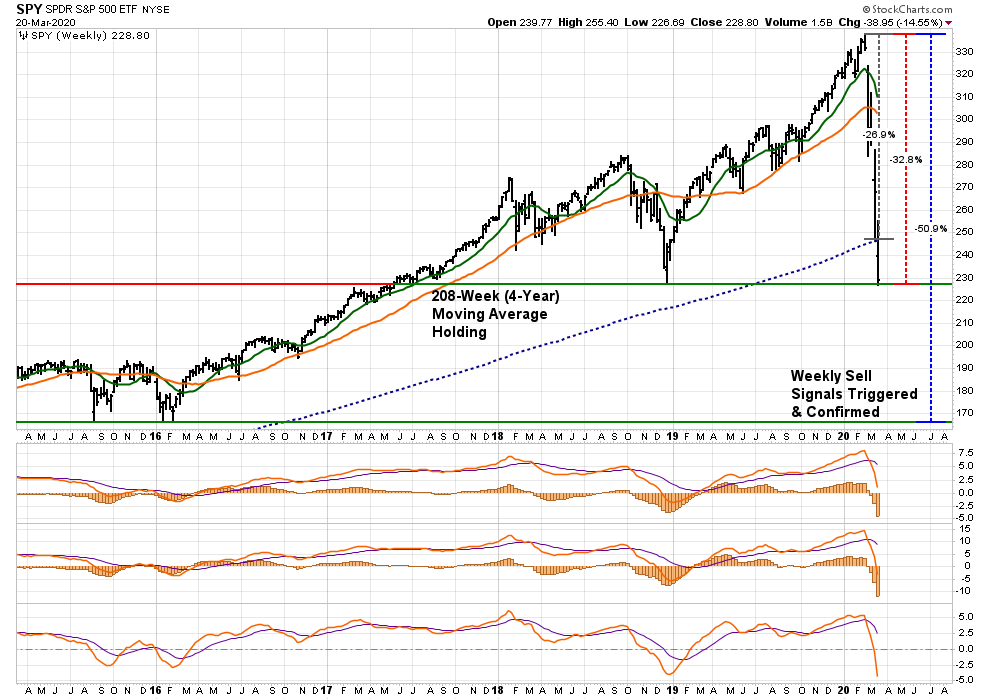
Where will that low likely be:
Let’s update our mapping from last week:
- A retest of current lows that holds is a 27% decline. – Failed
- A retest of the 2018 lows, which is most likely, an average recessionary decline of 32.8% – Current
- A retest of the 2016 lows, coincident with a “credit event,” would entail a 50.9% decline. – Pending Possibility.
Given the magnitude, and multiple confirmations, of these signals, it is far too soon to assume the “bear market” is over. This is particularly the case, given the selloff is less than one-month old.
Bear markets, and recessions, tend to last 18-months on average.
The current bear market and recession are not the result of just the “coronavirus” shock. It is the result of many simultaneous shocks from:
- Economic disruption
- Surging unemployment
- Oil price shock
- Collapsing consumer confidence, and
- A “credit event.”
We likely have more to go before we can safely assume we have turned the corner.
In the meantime, use rallies to raise cash. Don’t worry about trying to “buy the bottom.” There will be plenty of time to see “THE” bottom is in, and having cash will allow you to “buy stocks” from the last of the “weak hands.”


