Written by Lance Roberts, Clarity Financial
Data Analysis Of The Market & Sectors For Traders

S&P 500 Tear Sheet

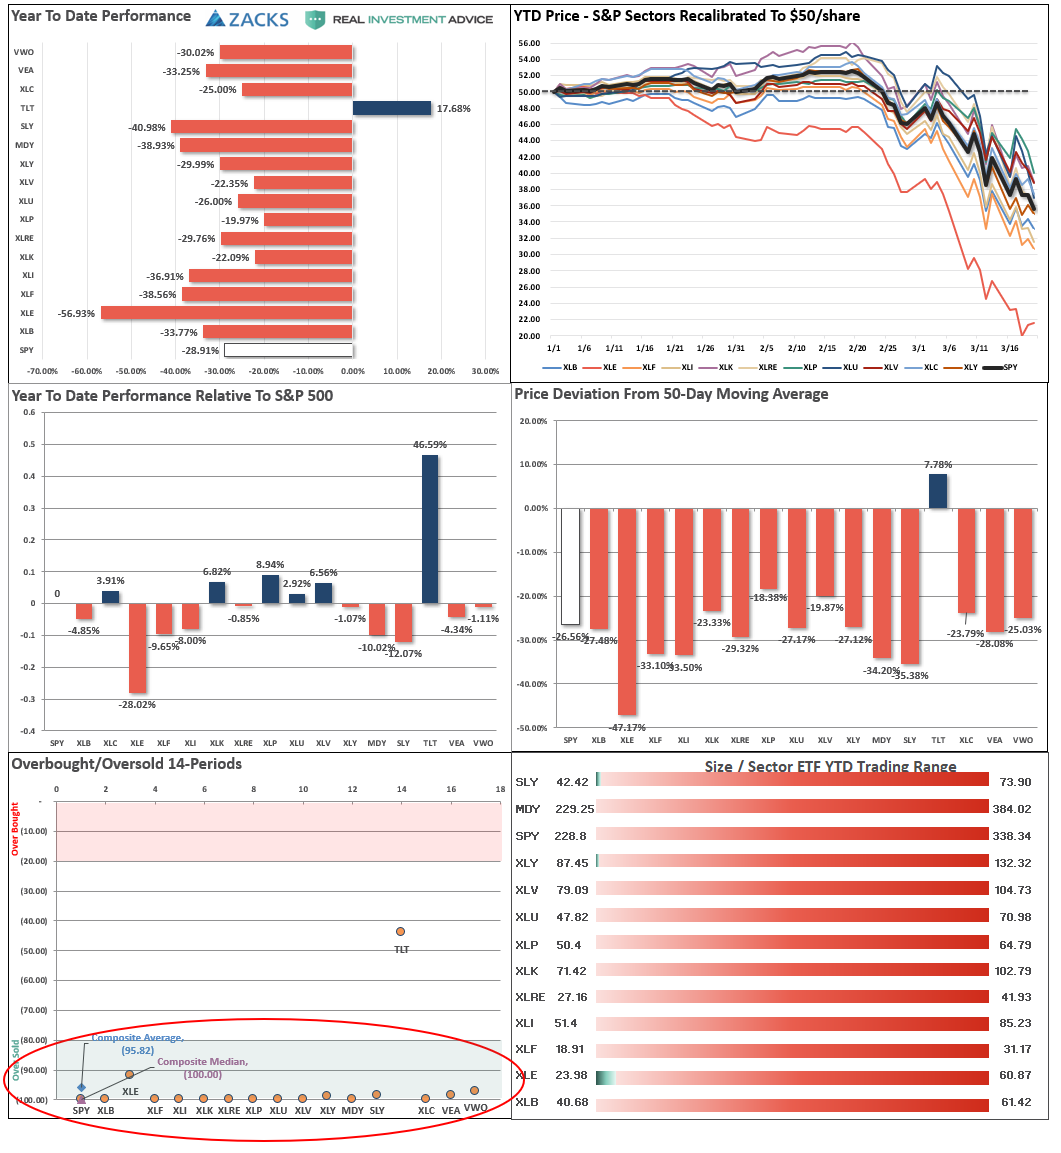
Performance Analysis
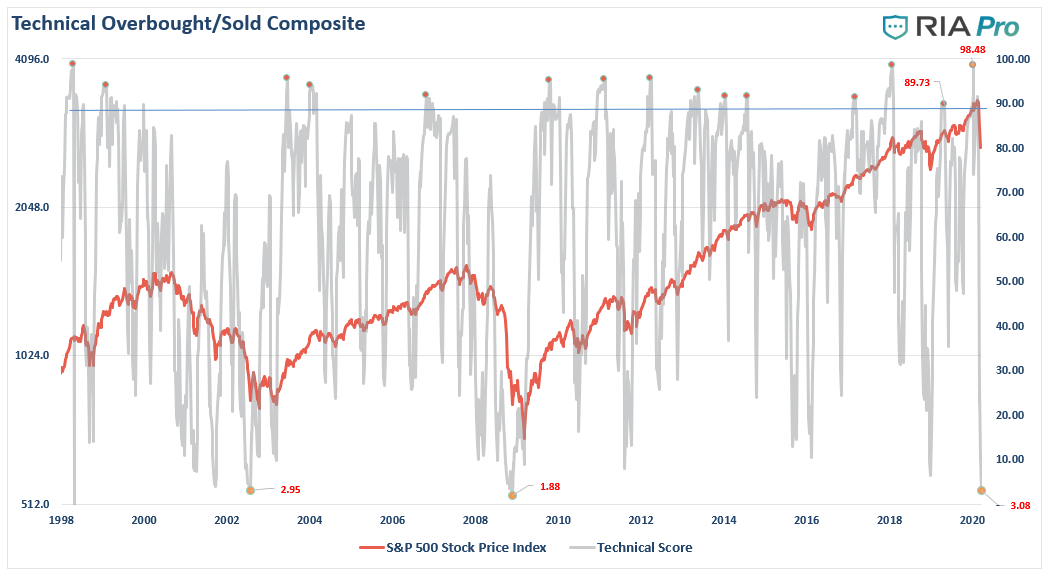
Technical Composite
Note: The technical gauge is now at the lowest level since both the “Dot.com” and “Financial Crisis.” However, note the gauge bottoms BEFORE the market bottoms. In 2002, lows were retested. In 2008, there was an additional 22% decline into early 2009.
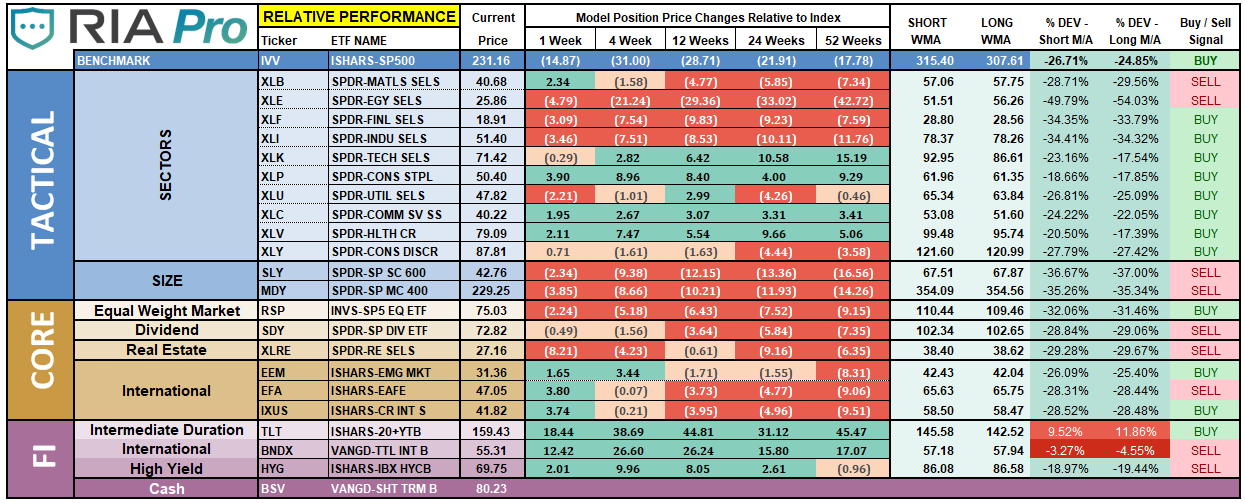
ETF Model Relative Performance Analysis
Sector & Market Analysis:
Be sure and catch our updates on Major Markets (Monday) and Major Sectors (Tuesday) with updated buy/stop/sell levels
Sector-by-Sector

For the 3rd week in a row:
“Everything was crushed again this past week, so the difference between leading and lagging sectors is which sector fell faster or slower than the S&P 500 index itself.”
Improving – Discretionary (XLY), and Real Estate (XLRE)
We previously reduced our weightings to Real Estate and liquidated Discretionary entirely over concerns of the virus and impact to the economy. No change this week.
Current Positions: 1.2 weight XLRE
Outperforming – Technology (XLK), Communications (XLC), Staples (XLP), Healthcare (XLV), and Utilities (XLU)
The correction in Technology last week broke support at the 200-dma but finished the week very close to the May 2019 lows. Communication and Utilities didn’t perform as well but also held up better during the decline on a relative basis. The same is true for Utilities and Staples. These are our core ETF’s right now at which we are carrying substantially reduced exposure.
Current Positions: 1/2 weight XLK, XLC, XLU, XLP, XLV
Weakening – None
No sectors in this quadrant.
Current Position: None
Lagging – Industrials (XLI), Financials (XLF), Materials (XLB), and Energy (XLE)
No change from last week, with the exception that performance continued to be worse than the overall market.
These sectors are THE most sensitive to Fed actions (XLF) and the shutdown of the economy. We eliminated all holdings in late February and early March.
Current Position: None
Market By Market
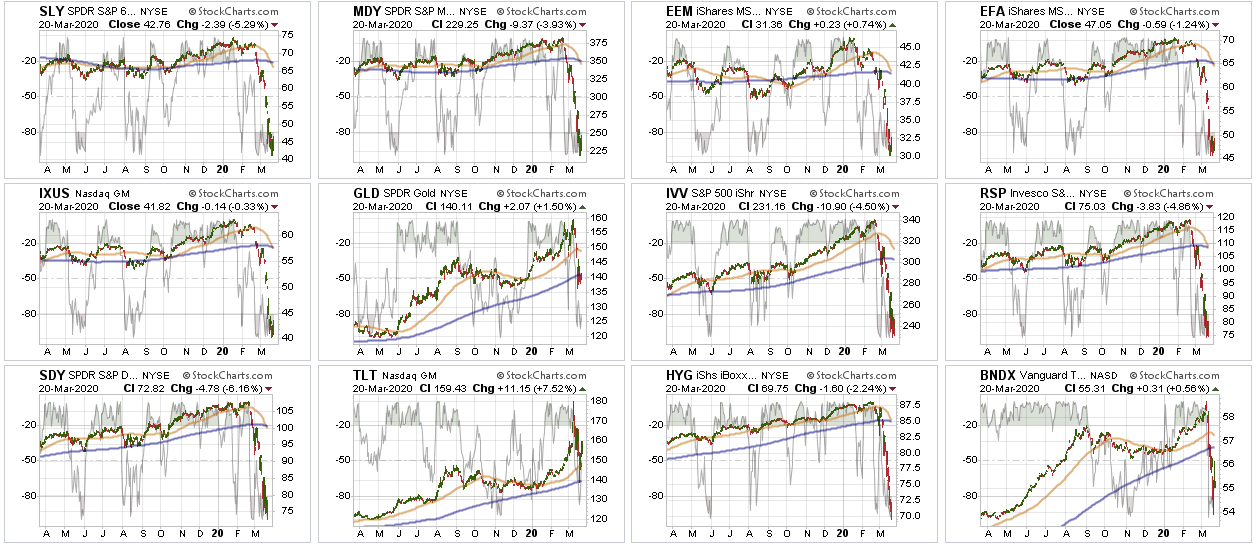
Small-Cap (SLY) and Mid Cap (MDY) – Three weeks ago, we sold all small-cap and mid-cap exposure over concerns of the impact of the coronavirus. Remain out of these sectors for now.
Current Position: None
Emerging, International (EEM) & Total International Markets (EFA)
Same as small-cap and mid-cap. Given the spread of the virus and the impact on the global supply chain. Trading opportunities only.
Current Position: None
S&P 500 Index (Core Holding) – Given the rapid deterioration of the broad market, we sold our entire core position holdings for the safety of cash.
Current Position: None
Gold (GLD) – Gold broke our stop, and we sold our holdings. We are now on the watch for an entry point if Gold can climb back above the 200-dma.
Current Position: None
Bonds (TLT) –
Bonds collapsed last week as the “credit event” we have been concerned about took shape. We had previously taken profits and reduced our bond holdings duration and increased credit quality. We have now reduced our total bond exposure to 20% of the portfolio from 40% since we are only carrying 10% equity currently. (Rebalanced our hedge.)
Current Positions: SHY, IEF, BIL
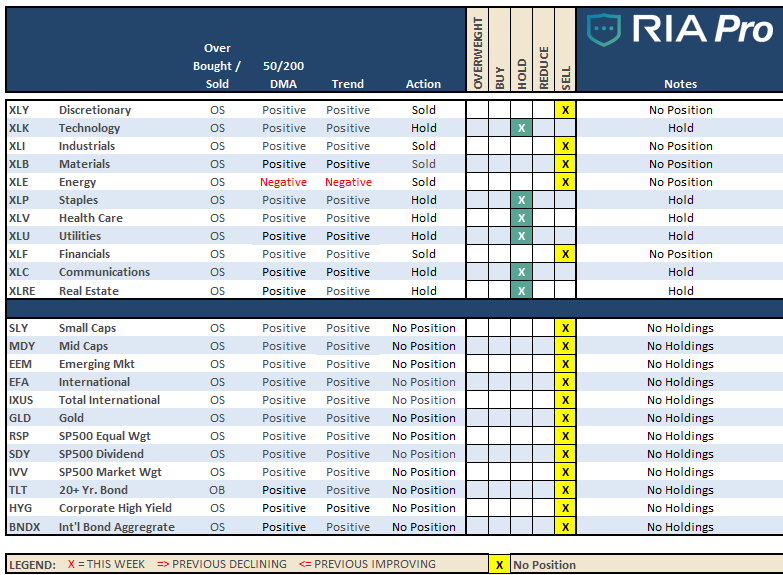
Sector / Market Recommendations
The table below shows thoughts on specific actions related to the current market environment.
(These are not recommendations or solicitations to take any action. This is for informational purposes only related to market extremes and contrarian positioning within portfolios. Use at your own risk and peril.)
Portfolio/Client Update:
I know it is ugly.
The S&P 500 is down nearly 32% in just three weeks.
That’s scary.
However, it is important to keep some perspective on where we are currently.
Last Monday, we further reduced our equity to just 10% (from 25% previously) of the portfolio
What does that mean? Here is some math:
If the market goes to ZERO from here, (it’s not going to) your MAXIMUM loss is just 10%.
This is recoverable, particularly if we could buy a portfolio of assets for FREE.
We currently expect a maximum decline from current levels of 20%. This would be a 2% net hit to portfolios leaving us with a LOT of cash to buy distressed assets at 50% off.
This is the opportunity we have been waiting for during the entire last decade.
Currently, we are busy rebuilding all of our portfolio models, rethinking risk management in a post-bear market environment, and what role the future of “fixed income” will play in asset allocations.
These are all essential questions that we need solid answers for.
We are in an excellent position with plenty of cash, reduced bond holdings, and minimal equity exposure in companies we want to own for the next 10-years. We are just patiently waiting to buy large chunks of these holdings soon with both stable and higher yields.
Let me assure you of four things;
- The ONLY people who care more about your money than you, is all of us at RIA Advisors.
- We will NOT “buy the bottom” of the market. We will buy when we SEE the bottom of the market is in and risk/reward ratios are clearly in our favor.
- This has been THE fastest bear market in history. We are doing our best to preserve your capital so that you meet your financial goals. Bear markets are never fun, but they are necessary for future gains.
- We’ve got this.
Please don’t hesitate to contact us if you have any questions, or concerns.
.


