Written by Lance Roberts, Clarity Financial
Since taking profits out of our portfolios, this leads us to the obvious question of whether or not the “Coronavirus Correction” is over?
From an investment standpoint, this is a fairly tricky question which brings up what we term in our practice as an “equity risk duration match.”

Please share this article – Go to very top of page, right hand side, for social media buttons.
On a very short-term basis, there is a potential for a reflexive bounce. If your “investment duration,” or rather your “investment holding period” is very short, there may be a “trading” opportunity for you. However, if your “duration” is a longer time-frame, like ours, then the short-term oversold bounce is likely an opportunity to “reduce risk” further into.
As they say, “a picture is worth a thousand words.”
We did this analysis for our RIAPRO Subscribers (Risk-Free Trial For 30-Days) this past week, which warned them of the potential for a deeper decline this week.
Daily – Short-Term
The market finally reversed some of the extreme 3-standard deviation extension (shaded areas) above the 200-dma, which we have discussed over the last couple of weeks. Such extensions, like stretching a rubber band too far, ALWAYS snap back eventually. We just never know what the catalyst will be that sparks the reversion.

With a “sell signal” clearly triggered (lower panel), it suggests, on a short-term basis, we are likely to see a “tradeable bounce.” However, until the signal reverses, any short-term bounce should probably be “sold into.”
Make no mistake, there is currently downside risk below the 50-dma to both the 38.2% and 50% Fibonacci retracement levels. From recent peaks, such a correction would entail a 5-8% decline, which is well within the normal range of a market correction within an ongoing bullish trend.
Weekly – Intermediate-Term
On a weekly basis the picture changes a bit. The bullish “buy” signal is still intact but is threatening a reversal which one more “down week” will likely accomplish. Furthermore, the market is NOT oversold as of yet, suggesting there is indeed downside risk currently, notwithstanding a short-term bounce. The best buying opportunities are when the weekly signal is oversold.
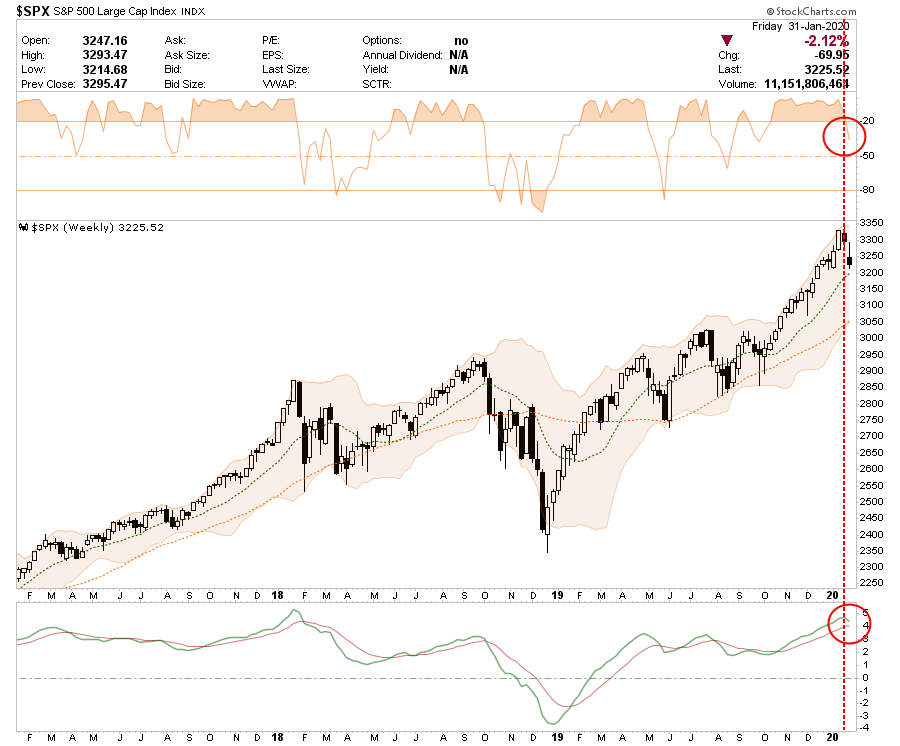
With the weekly “buy” signals still intact, such suggests the “correction” remains contained at the moment. However, these signals are valid only at the end of the week, so if there is further deterioration next week, there is a risk of a deeper correction developing. Previous corrections from such extended levels have ranged from 10%, to nearly 20%.
Monthly – Intermediate To Long-Term
On a long-term view, the market remains contained at the top of its bullish trend from the 2009 lows. Previous corrections have consistently tested both the mid- and lower bounds of the range. Don’t dismiss the statement above lightly. A test of the lower band of the range would wipe out 100% of the gains from 2019.
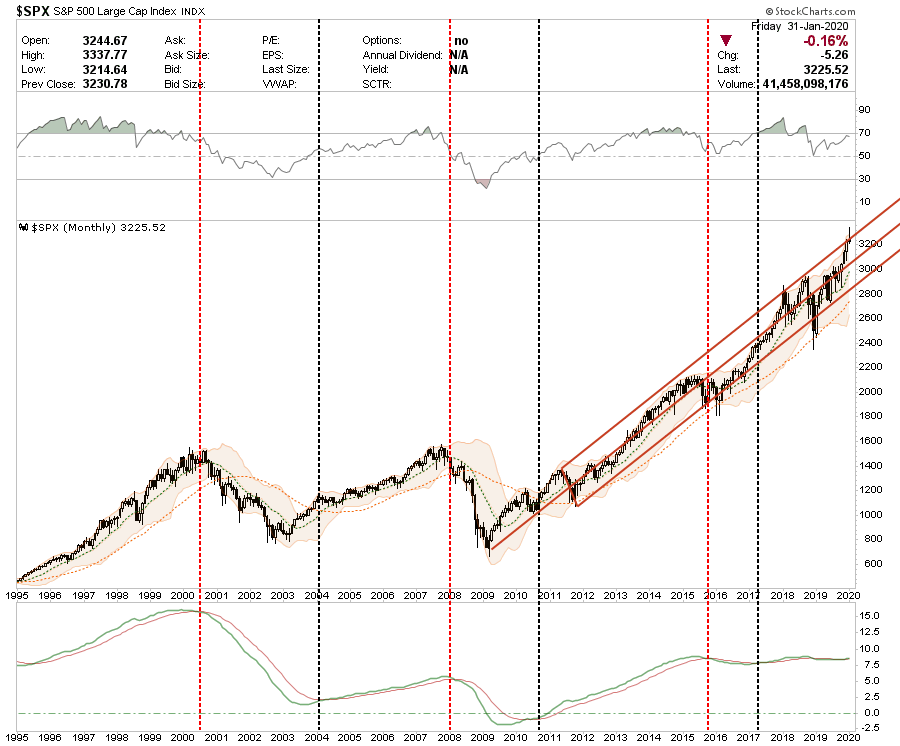
The market remains at risk of triggering a monthly sell signal (lower panel,) which has previously resulted in more severe bear markets and corrections going back 25-years.
Monthly data is very slow to move and is only valid at months end. This data is not useful for trading markets but is useful for risk mitigation and understanding when a “bear market” has genuinely begun.
Quarterly – Long-Term
As with the monthly data above, quarterly data is also not useful for trading portfolios. However, it provides a much deeper understanding of portfolio risk in the years ahead.
Currently, the market is extremely overbought (top panel,) and extremely extended (lower panel,) which has not previously been beneficial to investor returns over the following few years.
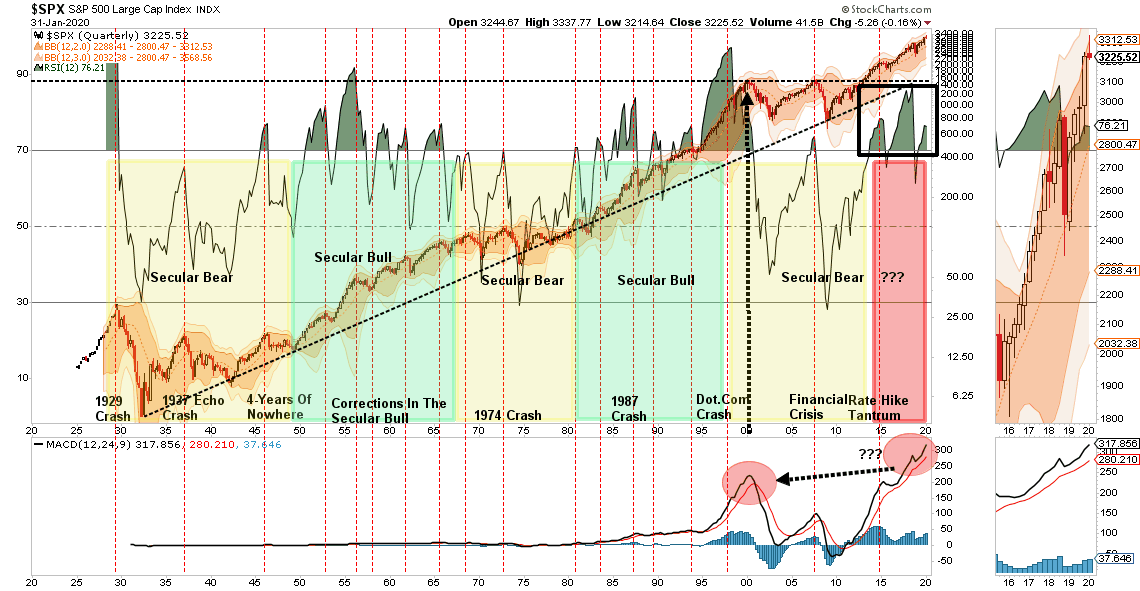
Importantly, what this data suggests is that betting on a “buy and hold” strategy over the coming decade is likely to leave you fairly disappointed. Risk is elevated and given the extreme long-term deviations on a variety of levels, an eventual “reversion to the mean” will be a more brutal event than what we have seen previously.
.


