Written by Lance Roberts, Clarity Financial
The first trading day of the year started with a “bang” with the S&P 500 rising more than 20 points. However, the gain was abbreviated on Friday as news shook the market the U.S. had taken out a top Iranian commander in Baghdad.

Please share this article – Go to very top of page, right hand side, for social media buttons.
But concerns over potential Iranian conflict quickly abated as the markets returned their focus to the Federal Reserve, and the continued pump of monetary liquidity into the markets. A point noted in our MacroView (to be posted later):
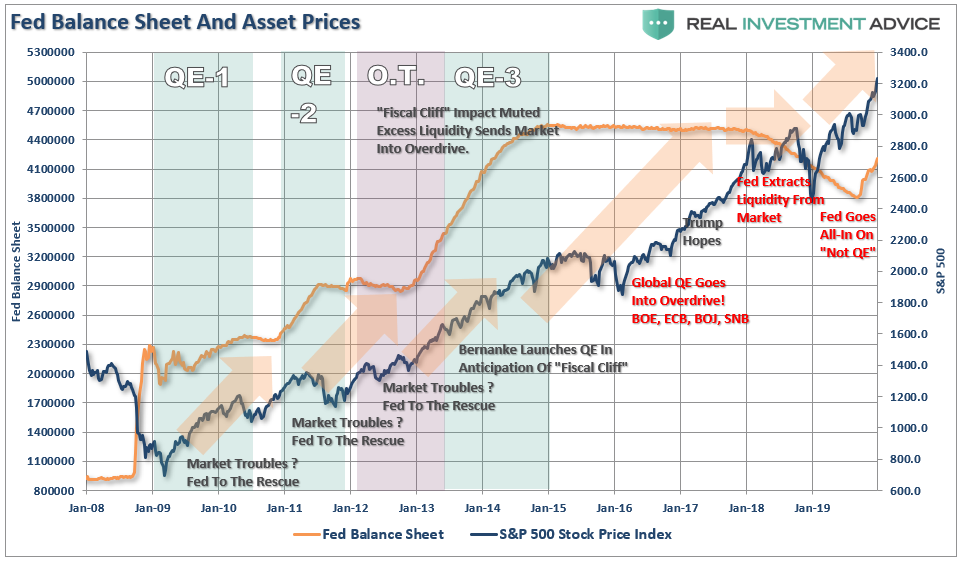
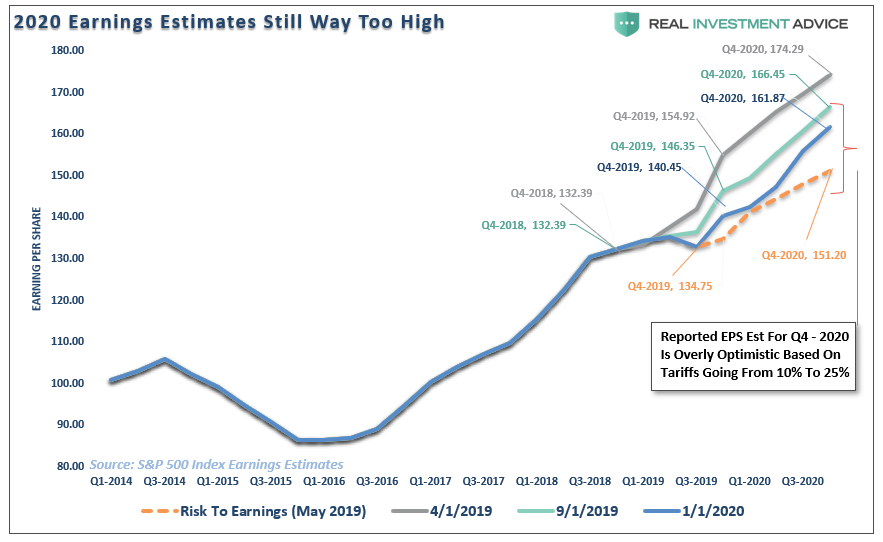
While the pump of liquidity continues to push asset prices higher, earnings continue to fall. Economic growth remains weak, and despite hopes for a “revival,” it has yet to be seen. Ultimately, stocks are a reflection of economic activity, and, as I predicted in May of last year, estimates were far too high relative to economic growth. Since then, earnings have continued to decline toward our original estimate. In fact, in just the last month, estimates for the end of 2020 fell by almost $2 per share. This is occurring at a time where investors are piling into stocks regardless of price or valuation. Such is just the “Pavlovian” response to more monetary stimulus.
This was a point made by Tom McClellan this past week:
“The efforts of the Federal Reserve to inject extra liquidity into the banking system over the past 2-months have helped to fuel the year-end (2019) rally. Questions remain about how long the Fed may choose to keep up that effort, and whether the Fed has enough ink in the printing presses to overcome other market forces.”
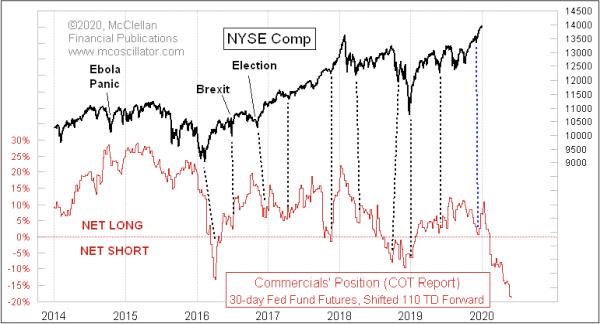
“The indicator in this chart depicts the net position of the ‘commercial’ traders of Fed Fund futures, expressed as a percentage of total open interest. The fun part comes when we realize that the movements of that indicator get repeated roughly 110 trading days later in stock prices.
Over the past 100 or so trading days, we have seen a big move in the commercial traders’ net position, moving from net long the Fed Funds futures to net short in a big way. It is the biggest such move we have seen in a few years; its implication is that there is a big down move coming for stock prices.”
Given the more extreme extension of stocks currently, Tom’s suggestion of a correction is likely particularly if the Fed decides to slow their monetary inputs.
As shown in the chart below, the market is currently trading 3-standard deviations above the 200-dma, which is somewhat of a rarity until just the last couple of years. Since the beginning of 2018, there have been three occurrences, with the previous two leading to short-term corrections.
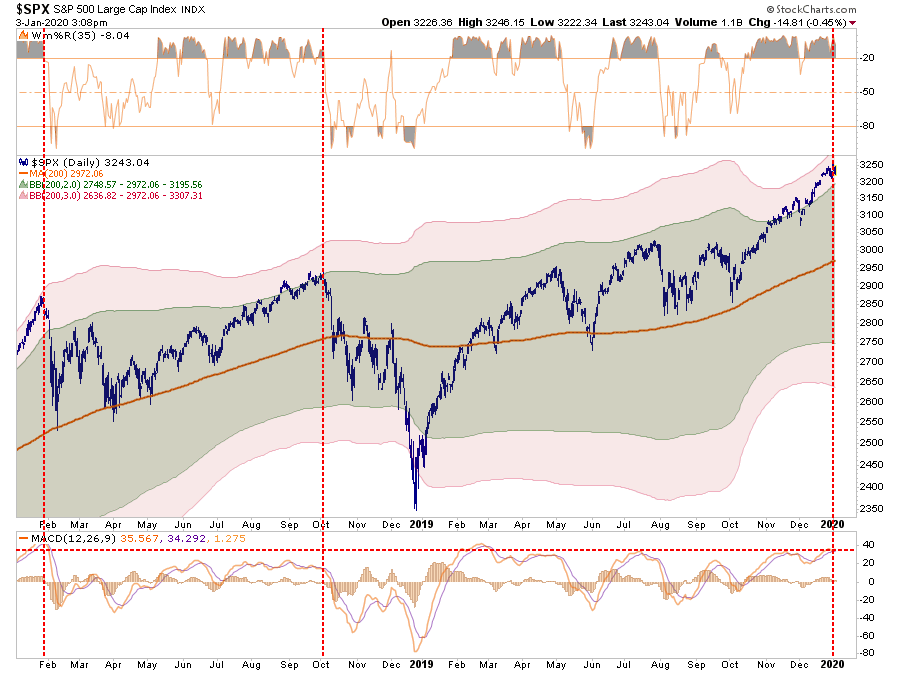
There is an important difference between the previous two incidents and today as the Fed was reducing monetary liquidity instead of increasing it.


