by Lance Roberts, Clarity Financial
The following four charts were tweeted out by my partner Jack Scott (@jackpscott) which will literally define the next decade.

Please share this article – Go to very top of page, right hand side, for social media buttons.
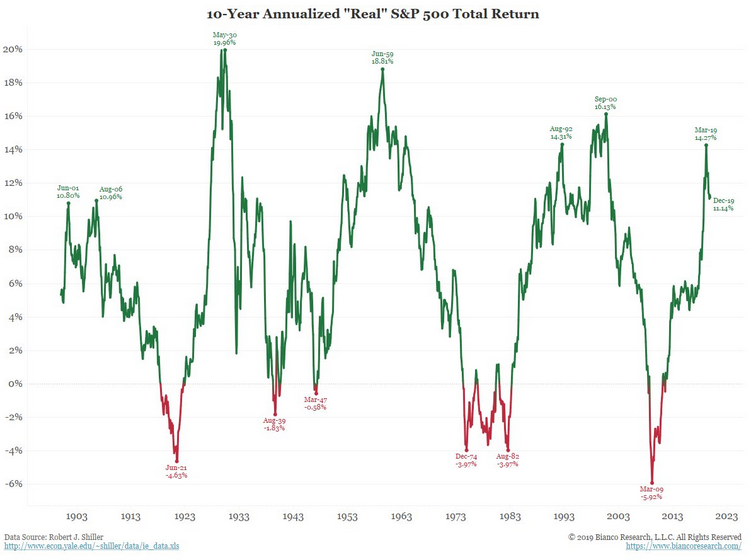
1 – Annualized Returns are one of the more “mean reverting” series in the financial markets. Decades of high returns are inevitability followed by a subsequent low, and even negative, returns. (If you are close to retirement this is an extremely critical point to understand when it comes to your financial planning.)
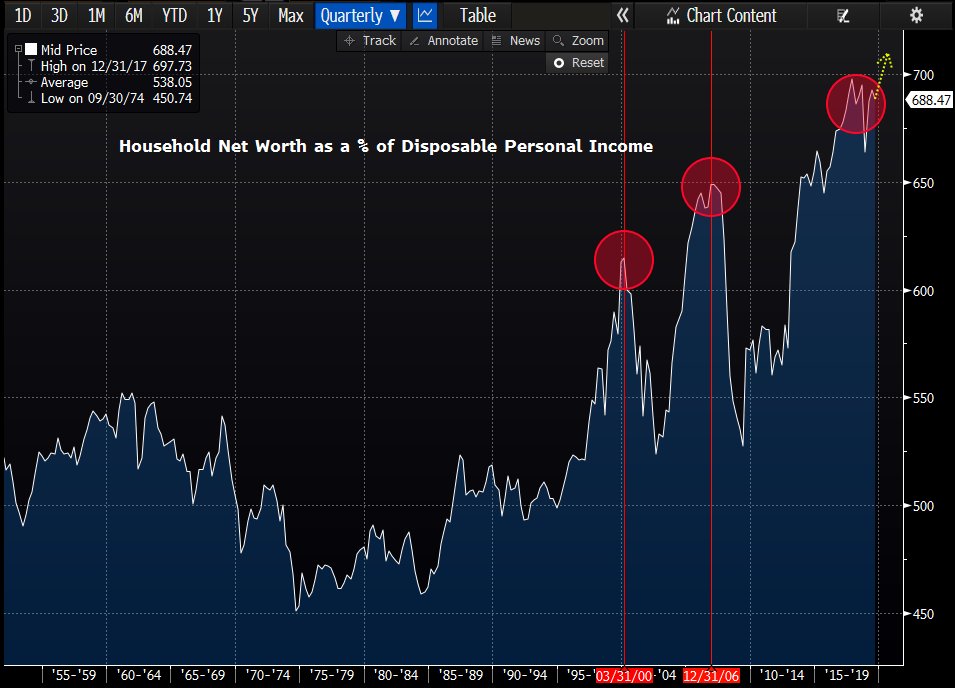
2 – Household Net Worth as a Percentage of GDP is pushing record levels. While not in itself a “bad thing,” the benefit has been confined to the top-20% income earners. Importantly, asset growth has far outstripped economic growth which is unsustainable long-term. This series too, will mean revert.
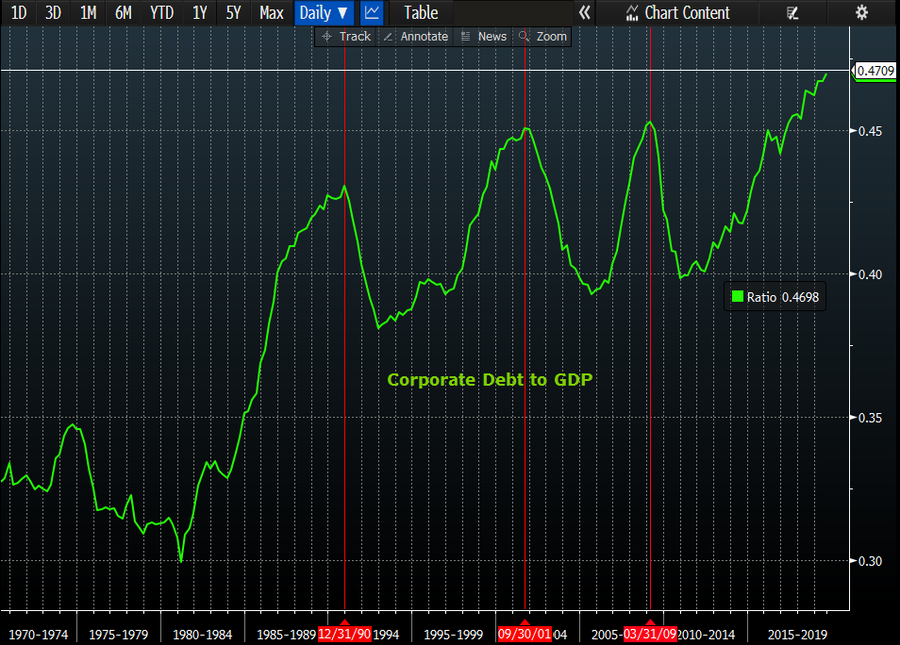
3 – Corporate Debt To GDP is also pushing unsustainable levels. Debt ultimately has to be “cleared” before the system can re-leverage for the next growth cycle. The next reversion cycle will be brutal on a large number of publicly traded companies which have relied on “cheap debt” to sustain poor fundamental business models. Be careful what you own.
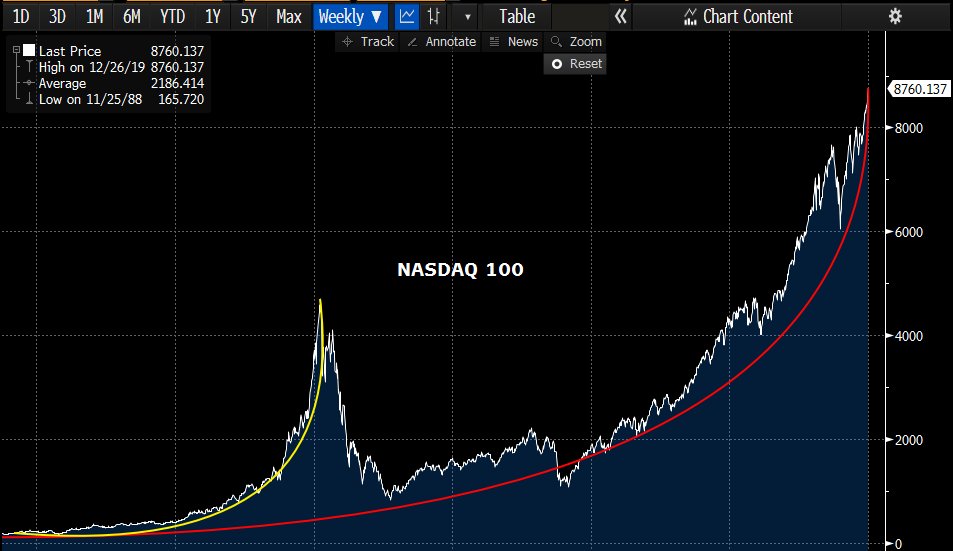
4 – Melt-Ups In Markets Can Seem Rational in the heat of the moment. However, when “reality” inserts itself, the eventual reversion tends to be brutal.
What you do with the data is up to you. All I am suggesting is that it took a decade of “fiscal largess” by Central Banks globally to create these extremes. It will likely take a decade to complete a reversion.


