Written by Lance Roberts, Clarity Financial
Last week I posted a series of charts which showed the rather rapid reversion from more extreme bearishness mid-summer to more extreme bullishness now.

Please share this article – Go to very top of page, right hand side, for social media buttons.
As I noted:
“But it isn’t just the more extreme advance of the market over the past 5-weeks which has us a bit concerned in the short-term, but a series of other indications which typically suggest short- to intermediate-terms corrections in the market.
Historically, when all of the indicators are suggesting the market has likely encompassed the majority of its price advance, a correction to reverse those conditions is often not far away. Regardless of the timing of that correction, it is unlikely there is much upside remaining in the current advance, and taking on additional equity exposure at these levels will likely yield a poor result.”
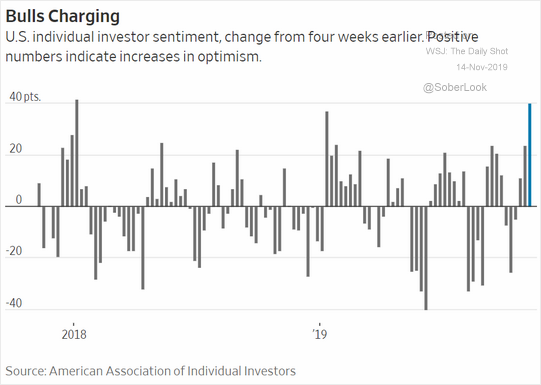
What is quite amazing is that this reversal from “bearish” to “bullish” occurred precisely as the Fed began pumping liquidity into the markets. The last time investor sentiment was this bullish was at the beginning of 2018, which eventually led to a near 20% correction.
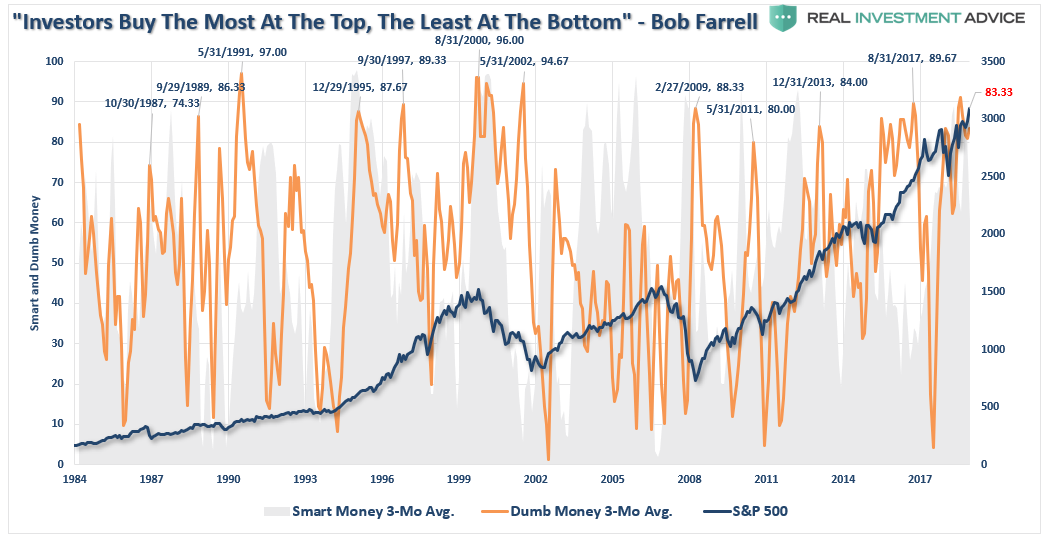
As with above, retail investors are “all in” once again with the smart/dumb money indicator noting an extreme bullish bias of retail investors.
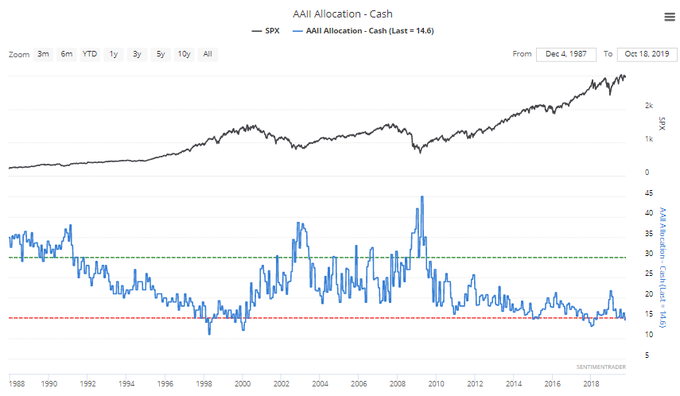
Of course, this coincides with extremely low individual cash levels of individuals.
“With cash levels at the lowest level since 1997, and equity allocations near the highest levels since 1999 and 2007, it suggests investors are now functionally ‘all in.’”
With net exposure to equity risk by individuals at historically high levels, it suggests two things:
- There is little buying left from individuals to push markets marginally higher, and;
- The stock/cash ratio, shown below, is at levels normally coincident with more important market peaks.
Lastly, for a “bullish sentiment” perspective, investment newsletters are now exceedingly bullish.

These are all “contrarian” indicators, which suggest that if everyone is “all in,” there is currently no one left to “buy.” Such conditions typically are associated with short-term market corrections.
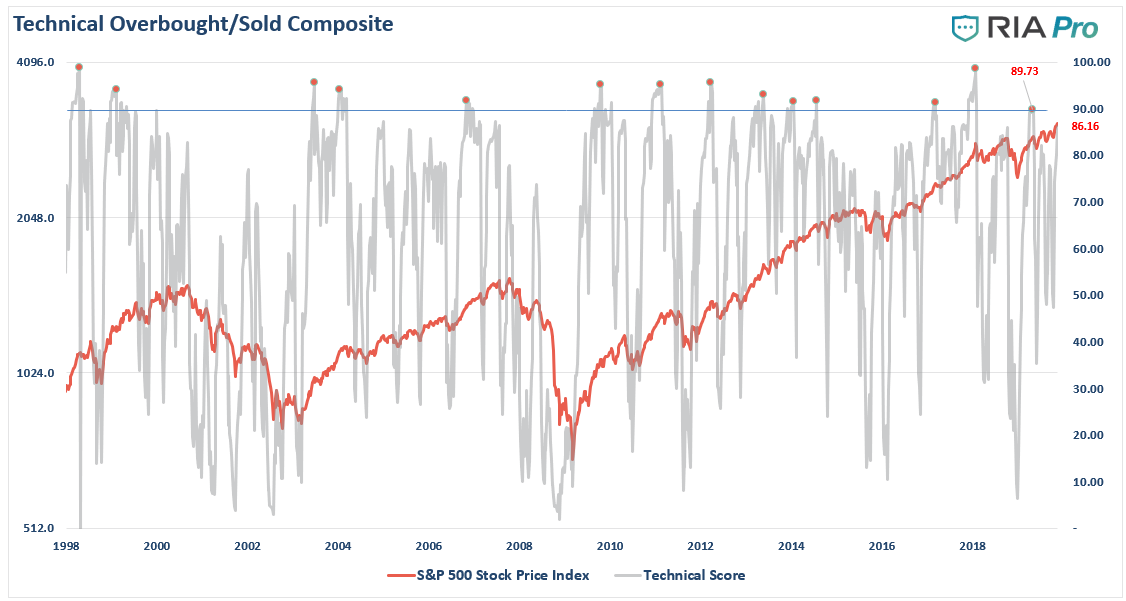
However, even if we set aside investor sentiment and positioning for a moment, the rapid reversion is price has sent our technical composite overbought/oversold gauge back towards more extreme levels of overbought conditions. (Get this chart every week at RIAPRO.NET)
As noted previously, virtually every measure of volatility has been suppressed as the “fear of a correction” has evaporated.

Low volatility measures
are a representation of more extreme levels of investor complacency. Such complacency provides “fuel” for a reversion as investors sentiment transitions from complacency to fear.
As we noted just recently for our RIAPRO.NET subscribers, the divergence of breadth is also indicative of short-term tops in markets.

What all of this data suggests is that markets have risen “too fast, too furious” which raises the probability of a price correction in the short-term.
This is why we have hedged our portfolios last week.
Does that mean we are bearish and betting on the market to crash.
Not at all.


