by UPFINA
In August real retail sales growth and real PCE growth were inversely correlated. Real retail sales showed the strongest growth since August 2018, while real PCE showed the weakest growth since December. Which trend should you follow? In short, real PCE includes more data; it is all encompassing. The categories in PCE that aren’t in the retail sales report stopped pushing real PCE growth higher.

Please share this article – Go to very top of page, right hand side, for social media buttons.
PCE Versus Retail Sales
PCE is the value of all goods and services purchased by or for U.S. residents as calculated by the BEA. The August PCE report showed $14.658 trillion in nominal sales. Retail sales measures the U.S. retail industry. The U.S. Census Bureau surveys 4,900 firms each month to collect the data in this report. In August, there were $526 billion in nominal retail sales. As you can see, PCE is much larger than retail sales. Examples of consumption included in PCE, that are not in retail sales are services like utilities, healthcare, going to the movies, and gambling.
At first glance, it might sound weird that we are going through this explanation since real PCE growth and real retail sales growth were almost identical. The difference lies in previous reports as real retail sales growth was higher than real PCE growth for the first time since May 2018. As the chart below shows, in the last recession, real retail sales growth fell much further than real PCE growth.
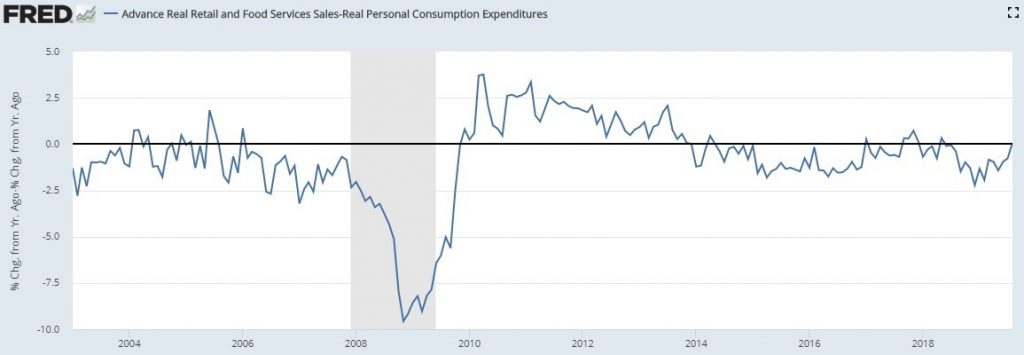
Source: FRED
Real retail sales growth is more volatile than real PCE growth. While real PCE growth encompasses more data, it appears, cyclically, the economy shows more strength when real retail sales growth is higher.
Can Rate Cuts Power A Manufacturing Recover?
The best catalyst for a cyclical recovery in 2020 might be global rate cuts rather than a trade deal. Rate cuts are certainly more likely to impact the economy since they have already occurred and the trade deal is still being negotiated. The track record of rate cuts leading to improvement in the global manufacturing PMI is solid. As you can see from the chart below, the global manufacturing PMI is correlated with the net number of global central banks cutting rates when the number of central banks cutting is pusher forward by 8 months. Since central banks have been cutting this year, the global manufacturing PMI could improve soon.

Even though this is JP Morgan’s chart of the week, the firm also mentioned that the global manufacturing PMI’s decline in new orders could lead to renewed weakness in the output index. (Since that statement, the September release showed the new orders index improved from 49 to 49.4.) On a related note, don’t be bearish on global growth and trade just because FedEx provided weak guidance that caused its stock to tumble. The trucking index is actually at a cycle high.
Start Of Earnings Season
Q3 earnings season will pickup later this month, but a few firms have already reported their results. For context, as of September 27th, Q3 EPS growth was expected to be -1.55% according to The Earnings Scout. To be clear, that doesn’t mean growth will be negative because firms usually beat EPS growth by around 3%. The consensus for Q4 growth, which we must follow the closest, is 6.01%. This estimate will fall in the next 3 months. The velocity of this decline during Q3 earnings season is pivotal.
As you can see from the table below, the first 14 firms to report Q3 results have had big declines in their Q4 EPS estimates.
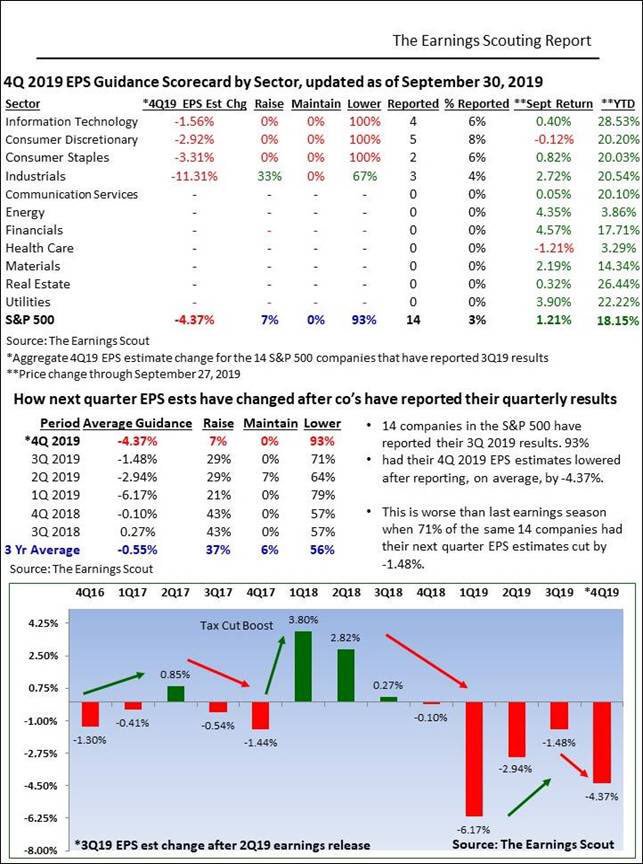
Source: The Earnings Scout
The average estimate change was -4.37%. These same 14 firms only had their Q3 estimates decline 1.48% after reporting their Q2 results. Q4 estimates are higher than Q3 estimates were which means they have further to fall. However, Q4 also faces much easier comps. We will be watching to see if weak economic growth leads to weak guidance. If estimates continue falling this much, stocks will fall in October and November.
FactSet is reporting weak results as well. In Q3, 82 S&P 500 firms have issued negative EPS pre-announcements. That’s the 3rd highest since Q4 2014. The 5 year average is 74. This weakness is being driven by tech which had 29 negative pre-announcements which is much above its 5 year average of 20.1. Healthcare had 15 which is above its average of 10.7.
Weak Chicago PMI
Supporting the thesis that there is an economic backdrop for weak earnings is the Chicago business barometer index. As you can see from the chart below, the index fell from 50.4 to 47.1 in September.
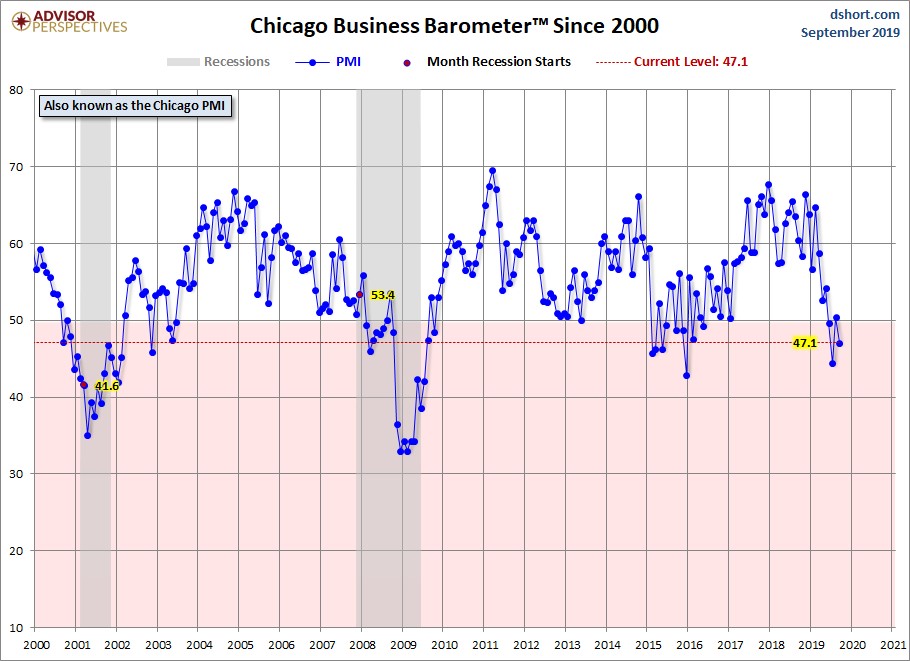
Source: Advisor Perspectives
The August reading was a blip higher in the midst of a downtrend. The production index fell 7.6 points to 40.4 which is the lowest reading since May 2009. Business confidence in Q3 fell 4.9 points to 47.3 which is the lowest reading since Q3 2009. The new orders index fell 7.6 points to 48.5. This report was terrible and borderline recessionary as backlogs fell from 51.3 to 46.8. The inventory index hit a 40 month low and the quarterly average of labor demand fell to 44.1 which was the weakest reading since Q4 2009. The overall barometer is below some of the readings in the last recession.
Chinese Manufacturing PMI Improves
Given the deleveraging in China and the trade war, it’s surprising that the manufacturing PMI improved from 50.4 to 51.4 in September which was the highest reading since February 2018. New orders grew at the quickest rate since March 2018. On the other hand, the employment and new export orders indexes were in contractionary territory. The demand came domestically since the trade war has weakened demand from America. As you can see from the chart below, the manufacturing PMI employment sub-index increased slightly to 47. Even with this mostly solid report, the 1 year outlook for output was weak.


Conclusion
Real PCE and real retail sales growth were almost the same. However, compared to recent results, retail sales growth looks strong and real PCE growth looks weak. Real PCE is more important since it measures a wider swath of economic activity. Rate cuts could drive a cyclical upswing in global manufacturing. Q3 earnings season has gotten off to a rough start. Can Q4 EPS growth be in the mid-single digits if the economy is weak? The September Chicago business barometer was weak. It’s almost recessionary. The Chinese manufacturing PMI actually improved in September despite the trade war.
.


