Written by Lance Roberts, Clarity Financial
Mark Kolanovic of J.P. Morgan penned:
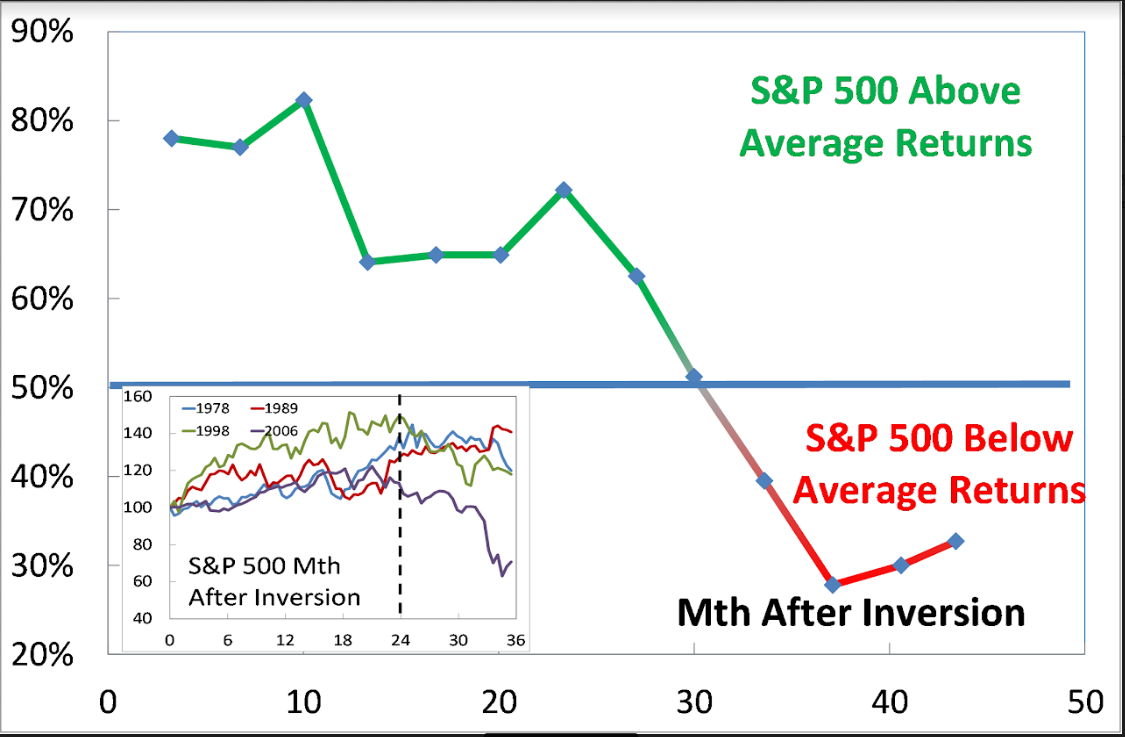
“Historically, equity markets tended to produce some of the strongest returns in the months and quarters following an inversion. Only after [around] 30 months does the S&P 500 return drop below average,”

Please share this article – Go to very top of page, right hand side, for social media buttons.
While the statement is not incorrect, it is advice that will ultimately lead to disappointment.
As discussed, in 1998 there was “no recession in sight,” and investors were repeatedly advised to ignore the yield curve because “this time was different.” Over the next two years, that advice held true as bullish optimism seemed well-founded. It was in early 2000 that Jim Cramer issued his Top 10-Stock Picks for the next decade.
The problem was that no one ever said “sell.”
While gains were made during the period between the initial yield curve inversion and the peak of the market, all of those gains, plus much more, were wiped out in the ensuing decline. By the time the selling was done, portfolio values had reverted to where they were roughly a decade earlier.
Since the majority of mainstream financial advice never suggest selling, investors had no clue that if they had gone to cash in 1998, they saved themselves both much grief, and years of losses to recover.
Following the “Dot.com” crash, the entire tragic event was considered an anomaly; a once-in-a-100-year event which would not be replicated anytime again soon.
Unfortunately, just 4-years later, in 2006, investors were once again told to ignore the yield curve inversion as it was a “Goldilocks economy” and “sub-prime mortgages were contained.” While many of the individuals who had told you to stay invested leading up to 2000 peak were mostly gone from the industry, a whole new crop of media gurus, and advisors, once again told investors to “ignore the yield curve.”
For a second time, had investors just sold when the yield curve inverted, the amount of damage that would have avoided more than paid off for the small amount of gains missed as the market cycle peaked.
This quad-panel chart below shows the 4-previous periods where 50% of 10-different yield curves were inverted. I have drawn a horizontal red dashed line from the first point where 50% of the 10-yield curves we track inverted. I have also denoted the point where you should have sold and the subsequent low.
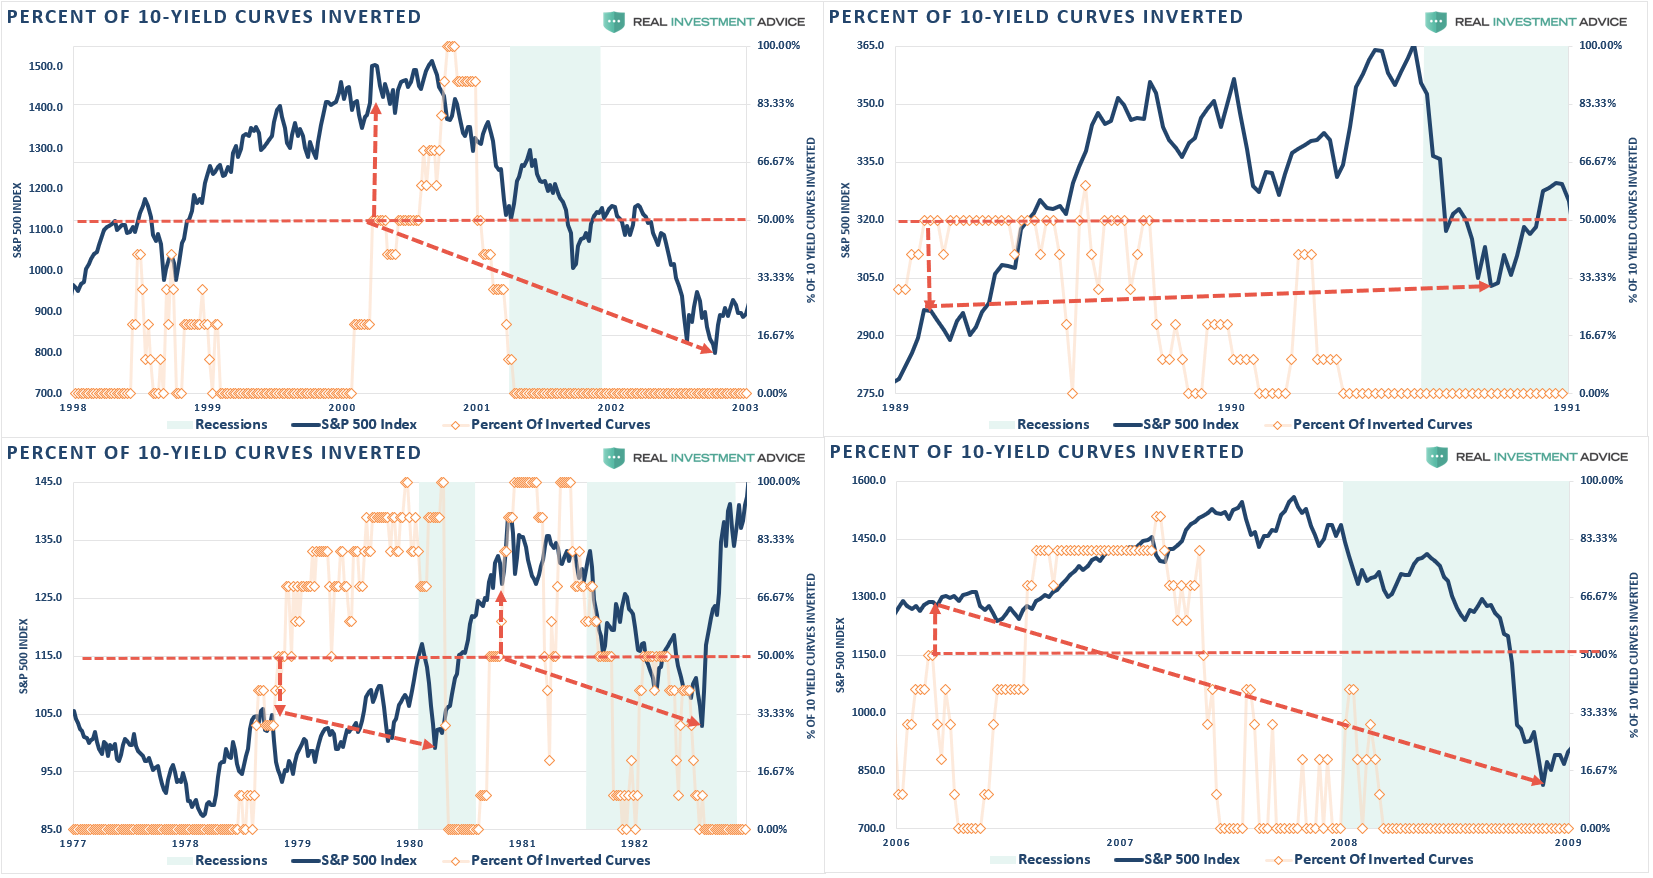
As you can see, in every case, the market did rally a bit after the initial reversion. However, had you reduced your equity-related risk, not only did you bypass a lot of market volatility (which would have led to investor mistakes) but ended up better off than those trying to “ride it out.”
That’s just history
Oh, as we noted last week, we just hit the 80% mark of inversions on the 10-spreads we track. (Historically, there has never been a point where 80% of yield curves were inverted that a recession wasn’t pending.)
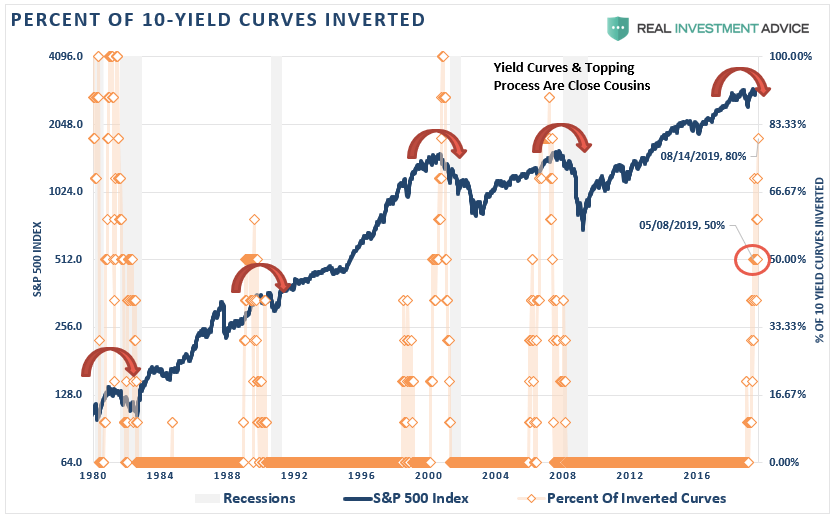
This time is unlikely to be different.
More importantly, with economic growth running at less than 1/2 the rate of the previous two periods, it will take less than half the amount of time for the economy to slip into recession.
The yield curve is sending a message which shouldn’t be ignored, and it is a good bet that “risk-based” investors will act sooner rather than later. Of course, it is simply the contraction in liquidity which causes the decline that will eventually exacerbate the economic contraction.
While it is unwise to use the “yield curve” as a “market timing” tool, it is just as unwise to completely dismiss the message it is currently sending.
Moreover, I am certainly NOT suggesting you sell everything and go to cash today. However, history is pretty clear that you will likely not miss much if you did.
If you need help or have questions, we are always glad to help. Just email me.
See you next week.


