Written by Lance Roberts, Clarity Financial
On Wednesday, CNBC ran a headline: “Dow plunges 750 points after bond market flashes a recession warning, Citigroup tanks 5%“.

Please share this article – Go to very top of page, right hand side, for social media buttons.
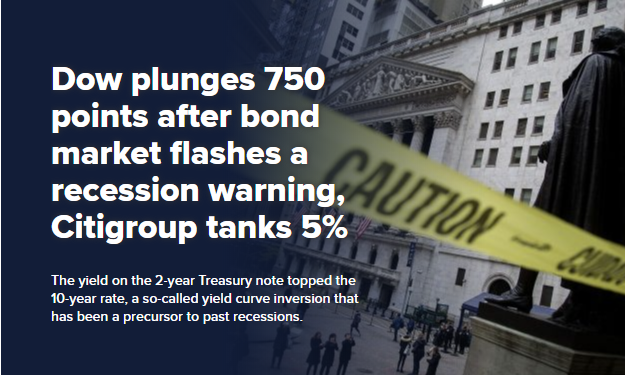
“Stocks plunged on Wednesday, giving back Tuesday’s solid gains, after the U.S. bond market flashed a troubling signal about the U.S. economy.” – CNBC
On Thursday, CNBC ran the following headline:

“Economists ratchet up their GDP forecasts for the third quarter to a median 2.1% after a batch of better-than-expected data, according to to the CNBC/Moody’s Analytics Rapid Update. The data paints a picture of an economy that looks nowhere near as bad as recent action in the bond market would suggest, and economists say it’s the strength of the U.S. consumer driving the economy. The manufacturing sector does show signs of strain, but the consumer is two-thirds of the economy and it is pulling its weight.”
So, which message is correct?
Let’s start with the economic data, which is showing a stronger than expected economy. The 6-charts below are the major measures of the economy most viewed by economists.
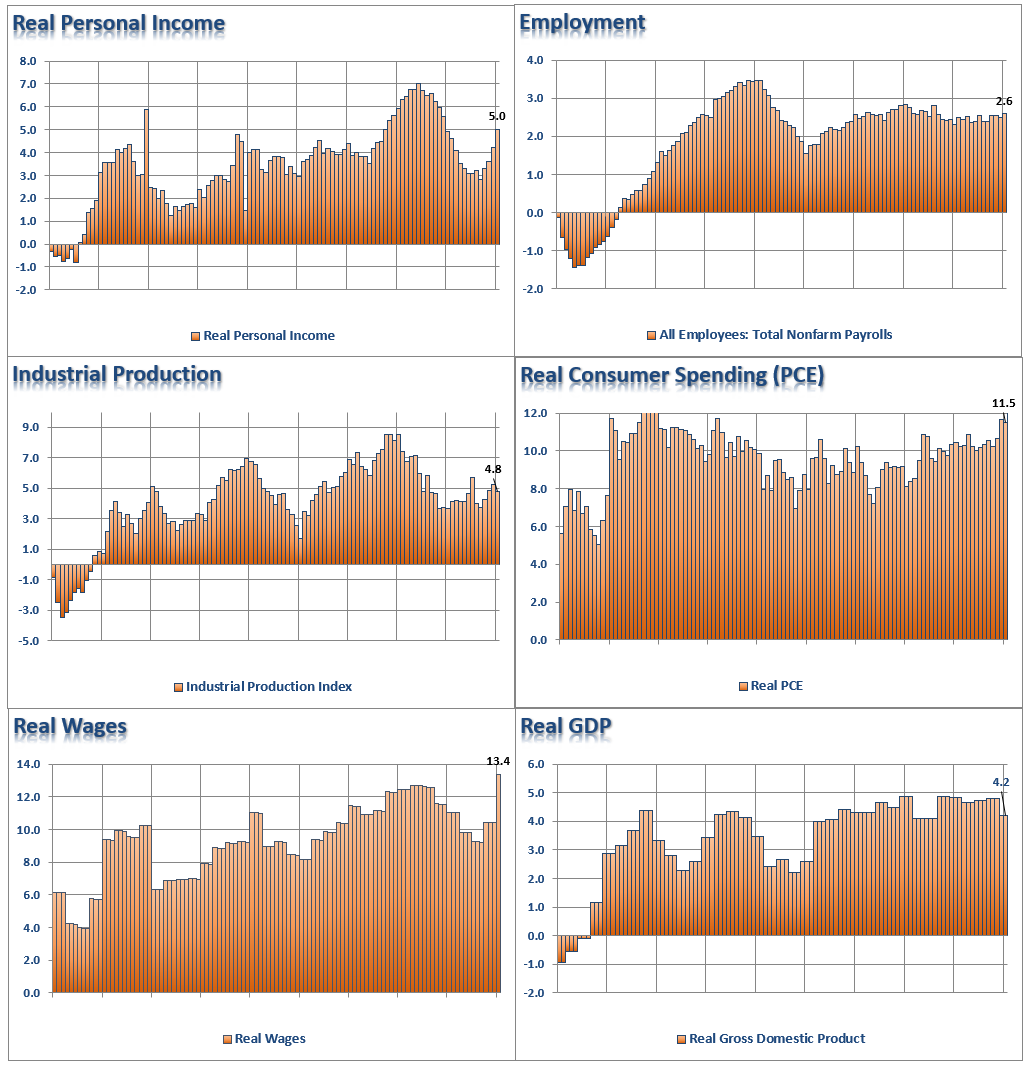
Clearly, there are NO signs of recession currently:
- 5% annualized real personal income growth
- 2.6% annualized employment growth
- 4.8% annualized industrial production growth
- 11.5% annualized real personal consumption expenditure growth
- 13.4% annualized growth in real wages
- 4.8% annualized real GDP.
Yet, the yield curve is close to inverting.
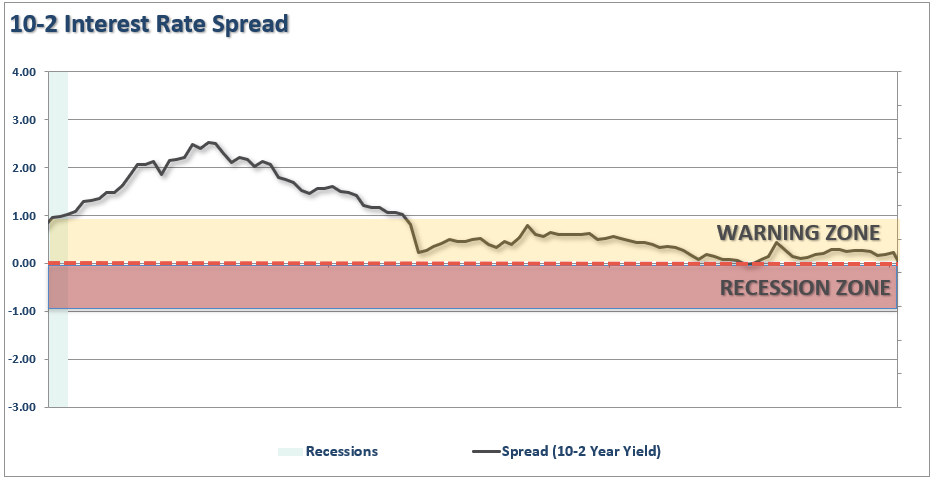
So, which indicator is right?
As an investor, should you be betting on the economic data, or the “yield curve?”
My apologies, I forgot to add the X-Axis to the charts above. (Not really, it was intentional)
That time frame is 1991 though 1999.
I don’t need to remind you what happened next.
Now, which indicator would you follow? The yield curve?
How about the stats in December 2007?
- 1.4% annualized real personal income growth
- 0.8% annualized employment growth
- 2.2% annualized industrial production growth
- 4.6% annualized real personal consumption expenditure growth
- 5.7% annualized growth in real wages
- 2.0% annualized real GDP.
Again, there is clearly no recession in sight, right?
Here is the yield curve from 2003-2008

So, how about today.
CNBC says the consumer is strong, and the yield curve is wrong.
Here is the 6-panel chart of the current economic cycle to compare to the chart above.
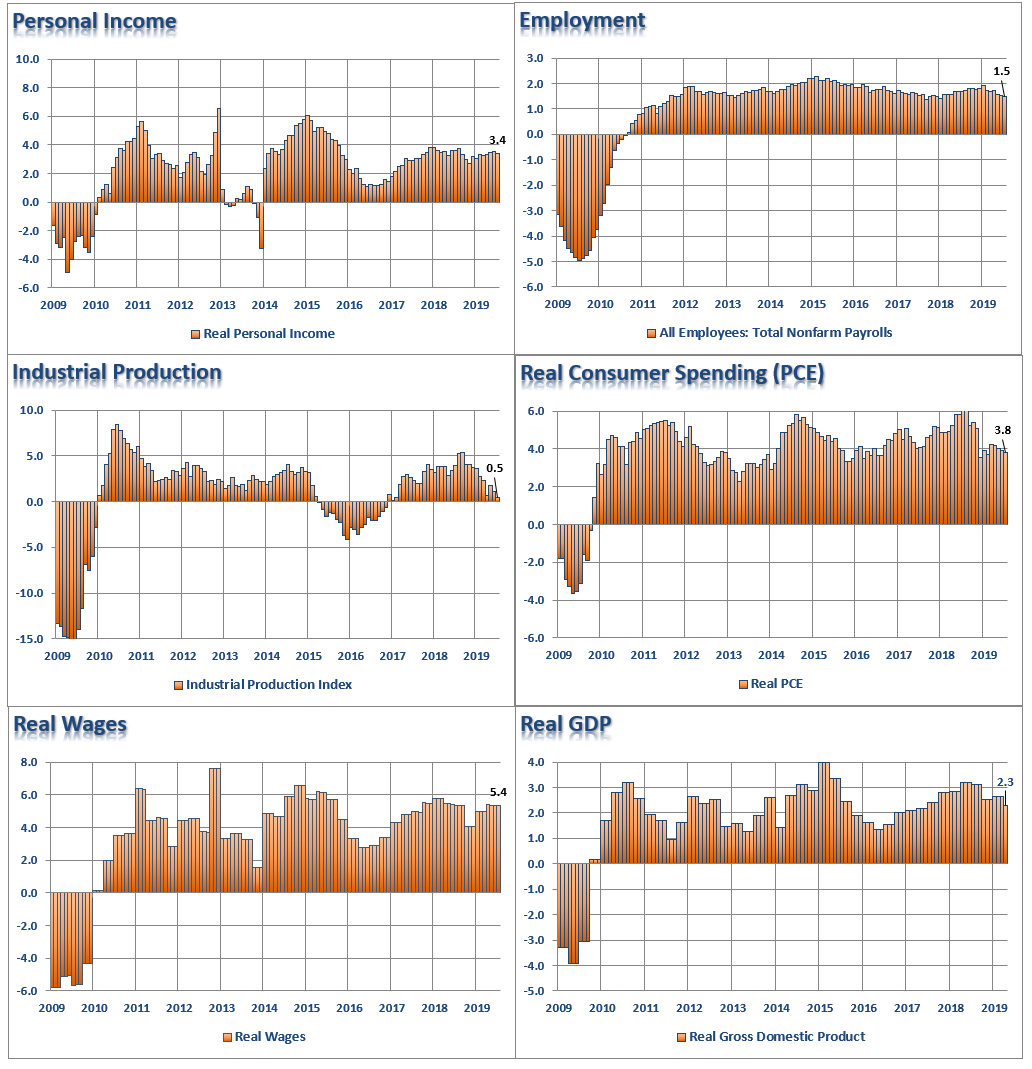
(It is worth comparing the markedly weaker economic growth statistics between today and the late 90’s. This goes a long way in explaining the disparity of wealth in the country today and surging debt levels.)
Here are the final stats as of the latest reports:
- 3.4% annualized real personal income growth
- 1.5% annualized employment growth
- 0.5% annualized industrial production growth
- 3.8% annualized real personal consumption expenditure growth
- 5.4% annualized growth in real wages
- 2.3% annualized real GDP.
To CNBC’s point, based on this lagging, and currently unrevised, economic data, there is “NO recession in sight,” so you should be long equities, right?
Here is that pesky yield curve again. (2009-Present)
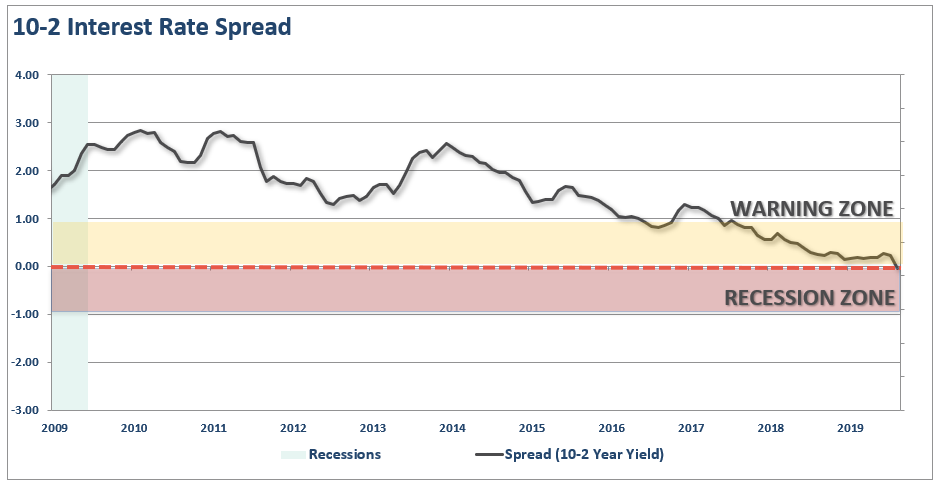
Which indicator should you follow?
The yield curve is an easy answer.
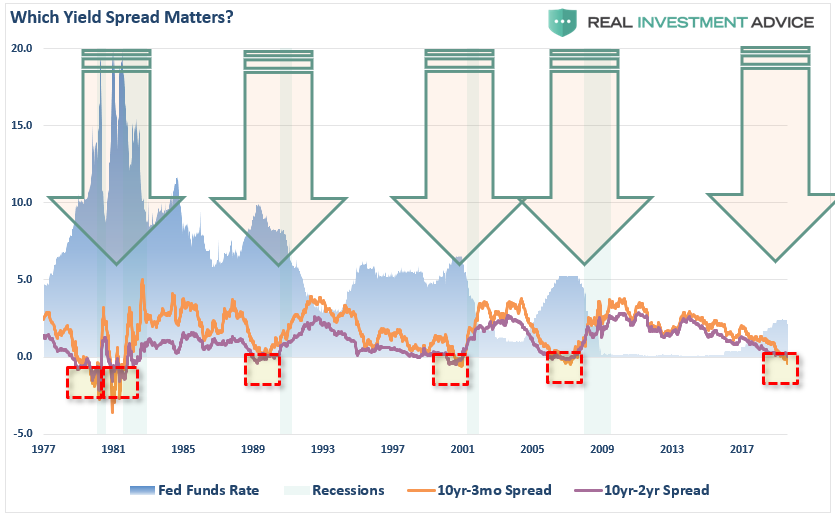
While everybody is “freaking out” over the “inversion,” it is when the yield-curve “un-inverts” that is the most important.
The chart below, shows that when the Fed is aggressively cutting rates, the yield curve un-inverts as the short-end of the curve falls faster than the long-end. (This is because money is leaving “risk” to seek the absolute “safety” of money markets, i.e. “market crash.”)
As noted above, the current economic data is only a “guess” about the current economy. In the next 12-months, we will see the “revised” data, but the yield curve is already telling you it will be weaker.
Just as in December 2007, there was “no recession.” It wasn’t until December 2008 that the data was revised, and the National Bureau of Economic Research (NBER) announced the recession had begun a full year earlier in December 2007.
By the time the announcement was made, it did little to help investors avoid the damage. The chart below is the historical track record of recession dating and market turns.
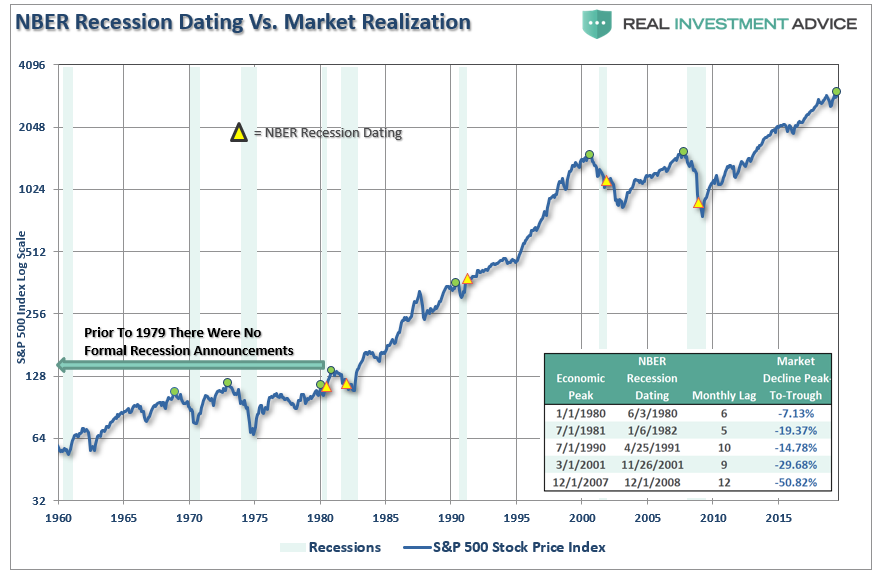
Despite commentary to the contrary, the yield curve is a “leading indicator” of what is happening in the economy currently, as opposed to economic data which is “lagging” and subject to massive revisions.
More importantly, while the consumer may be continuing to support growth currently, such can, and will, change dramatically when job losses begin to occur. Consumers are fickle beasts, and when a change in psychology occurs, it will happen very rapidly.


