


by UPFINA
We don’t usually go through the day to day trading action in markets because we are focused on the cyclical nature of the economy as well as long term secular trends. However, the action on Thursday August 1st was probably the most interesting and perplexing of the year so it must be discussed. Just like most of the year, the stock market and treasury market rallied in the morning. The stock market rallied on the ‘bad news is good news’ narrative because the weakness in manufacturing made the case for more Fed rate cuts.

Please share this article – Go to very top of page, right hand side, for social media buttons.
Interesting Market Reactions
Thursday was filled with interesting market reactions with the odds of a rate cut in September jumping from 50.7% to about 80% after the Fed explained on Wednesday why their cut was an adjustment cut rather than the start of a new easing cycle. This is despite the manufacturing reports which weren’t that bad versus expectations. Although they were not great either. We will review them and the weak construction report later in this article. However, keep in mind that the Challenger Job Cut report showed fewer job cuts and the jobless claims report was strong again.
While generally the Fed’s most powerful tool is forward guidance, given the noncommittal stance towards future rate cuts by the Fed, the market is making a decision on behalf of the Fed with regards to the likelihood of the next policy action. At first, the Fed’s indecision about future rate cuts created significant volatility in future rate cut expectations by market participants on Wednesday. However, following the tariff announcement, the probability shifted decisively in favor of more cuts. The chart below shows the probabilities after the tariff announcement.
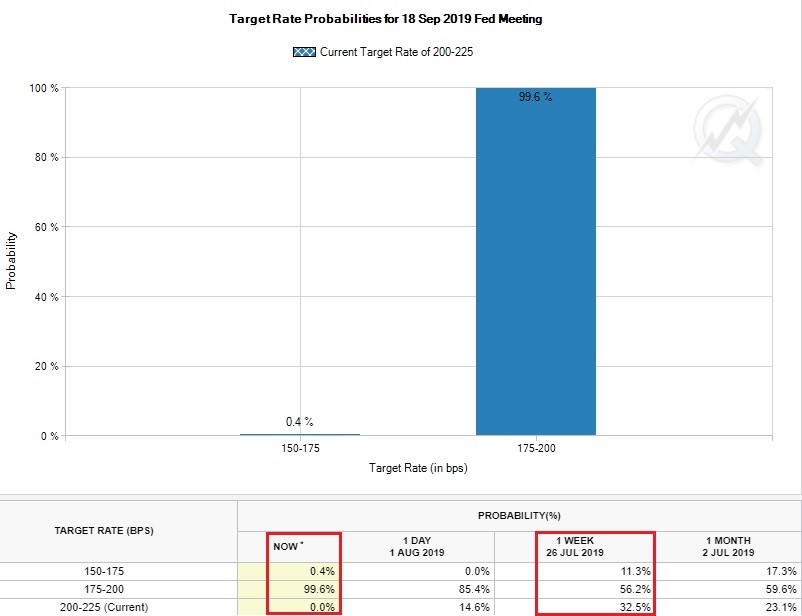
Source: CME Group
As if that wasn’t enough news for the day, President Trump tweeted that the trade negotiations with China were ongoing, but that he is implementing a 10% tariff on $300 billion worth of goods starting on September 1st. Now all Chinese exports are being taxed. His next threat is to tax these goods at 25%. Remember this tranche is largely capital & consumer goods. Stocks fell on this news and the market had a better reason to expect a rate cut in September.
Logically, this market action doesn’t make sense. Stocks rallied on the bad economic news because they mean more rate cuts. Afterwards, stocks sold off on the tariff news which also means more rate cuts. To be fair to the market, the manufacturing weakness was expected, and the new tariff wasn’t. This tariff could be him pressing China to negotiate more seriously.
Government Bonds Are On Fire
Treasury yields fell rapidly on Thursday and Friday as the 10 year yield fell to 1.86% which is the lowest level since November 2016. The 2 year yield fell to 1.72% which means the difference between the 10 year 2 year yields fell to 14 basis points which is 4 basis points away from the cycle low. The curve is nearing an inversion. There has been a global decline in yields due in part to rate cuts by central bankers and the global cyclical slowdown which is causing increased demand for government bonds.
As you can see from the chart below, the 3 month annualized returns in the JP Morgan global government bond index are the highest since 2009.

Returns are in the 99th percentile. (Keep in mind this data doesn’t include the latest couple of days rally in treasuries).
Most Global PMIs Are Below 50
As we mentioned, the global slowdown is being priced in. That makes sense because the global manufacturing economy is in a recession. As you can see from the chart below, the percentage of countries with a manufacturing PMI of 50 or higher is declining.

We stated the new data on Thursday shouldn’t have been enough to shift rate cut odds that much because this new data shouldn’t be a surprise. The July JP Morgan global manufacturing PMI only fell 0.1 as it went to 49.3. That’s the lowest reading since October 2012. 19 of 30 countries contracted, which is the most since August 2012. Yes, the manufacturing sector is still weak, but that’s not news. The new orders index actually increased from 49 to 49.3.
Weak June Construction Spending
The construction spending report was the weakest new data that was released on Thursday as monthly growth in June was -1.3% which missed estimates for 0.3%. At least growth in May was revised higher from -0.8% to -0.5%. Yearly growth in June was -2.1% and it was revised higher from -2.3% to -1.6% in May. Public spending on educational buildings and highways & streets fell sharply on a monthly basis, but still rose in the mid-single digits on a yearly basis. Yearly spending growth on state and local construction was 5.9%; growth was 9.7% on federal construction. There was some weakness in private non-residential construction as it fell 0.4% yearly. Manufacturing was strong as it was up 10.5% yearly. Commercial building had positive monthly growth, but it fell 12% yearly.
The real weakness was in residential construction as it fell 8.1% yearly. Real residential investment has been negative for 6 straight quarters. It might be negative a 7th if this keeps up. As you can see from the chart below, single family construction fell 8.5% (it fell 0.7% monthly).
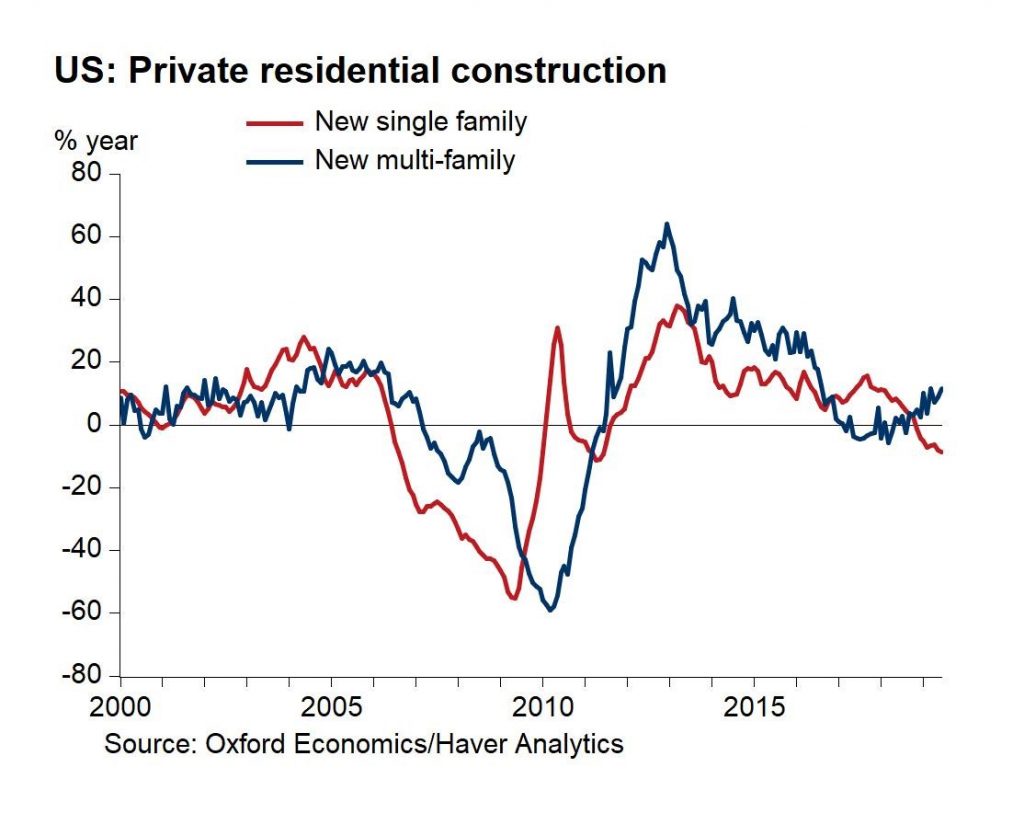
Source: Oxford Economics
Home improvements fell 5.1% yearly. Only multi-family construction did well, but it wasn’t enough to offset the weakness in the other categories.
Slight Markit PMI Increase From Flash Reading
The July manufacturing Markit PMI was 50.4 which is up 0.4 from the flash reading and down 0.2 from June.

This is a good example of a weak report that probably shouldn’t have moved markets because it was a slight improvement from 2 weeks ago. That being said, weakness remained as employment fell for the first time since mid-2013. Output expectations were the lowest ever (since July 2012). Purchasing activity fell for the first time since April 2016. This report is consistent with manufacturing production declining at an annualized rate of over 3%.
Conclusion
Thursday was odd for 2 reasons. Firstly, the odds of rate cuts increased because of weak manufacturing reports that should have been expected. Yes, construction spending was weak. However, Challenger Job Cuts fell, and jobless claims were low again. The second confusing aspect is stocks rose on weak economic data catalyzed by expected monetary stimulus, but then they fell on the tariff news. The weak economic reports and new tariff are both bad news. The tariff might actually have a greater impact on future rate cuts than the weak economic data because it was unexpected. Stocks probably fell because this was a very unexpected tariff since negotiations were presumed by most to be going well.
.


