Written by John Lounsbury
One month ago we posted a note alerting readers to a rally in U.S. treasuries which seemed problematic in that it was occuring when the economy still seemed to be relatively strong and treasury yields had dropped quite precipitously in less than 6 months time. Let’s revisit that and review what has happened since.

Please share this article – Go to very top of page, right hand side, for social media buttons.
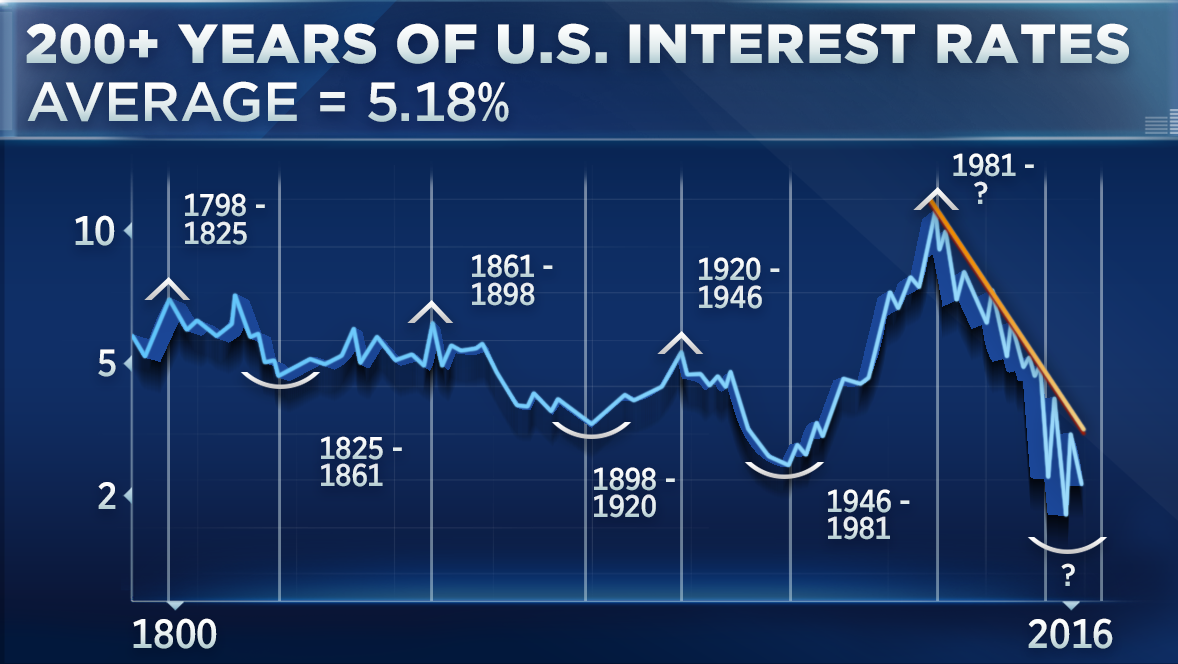
Among the observations we made last month was that for the entire history of the country interest rates had been as low as they are now only during the Great Depression and World War II. (Graphic from CNBC.)
Click on any chart below for large image.
The following two graphics from last month’s note show the 5-year and 1-year history of the 10-year treasury yield up to that dat (May 10):


From last month’s article:
There was a bear market correction in 2017 as yields declined from about 2.6% to 2.05% over 9 months. Then the bear trend resumed to a high rate near 3.25% at the beginning of October 2018. Since then there has been another correction lasting nearly 9 months to the current rate of 2.45%.
Question: Is the current market a mirror image of the 2017 correction or could the bond rally be extended?
The 12-month chart makes clear that we won’t have to wait long to find out.
The trading channel for the current trend is quite steep and in the shape of a descending flag. In order for the current trend to continue the 10-year yield will have to fall below 2.3% in less than 6 weeks because that is where the resistance line (upper boundary of the channel) will be in that time. If there is an inflection point for treasuries this decline will not happen and the upper boundary of the flag will be violated very soon.
Well, in just 4 weeks the yield has dropped far below the 6-week move we defined as necessary to maintain the bullish trend. (Bullish because bond prices rise when yields fall.)
Here is the new chart for the last year (ending June 07):

Observations
- The trend lines now more nearly define a channel (nearly parallel) whereas last month they looked more like a flag.
- The current yield is near the bottom of the channel.
- In approximately 2 months the top of the channel will be at 2.0% (and the bottom near 1.65%).
Conclusions
- The likelihood that this bull rally can continue for another 2 months is problematic.
- Continuation of this rally through the summer would likely mean the economy was headed into the tank and the stock market much lower.
- Continuation of this rally through the summer would produce the mother of all yield curve inversions unless the Fed cut rates a lot more than anyone is considering possible right now.
So, in short, betting on bullish bonds over the coming months is betting on disaster.
Two GEI contributors (Jim Welsh and Lance Roberts) have been bullish on bonds so far this year. You should follow their weekly posts to follow how they see this drama playing out over the summer.
.


