
Written by Jeff Miller, A Dash of Insight
— this post authored by Mark D. Hines
Our previous Technical Thoughts asked if you’ve ever thrown in the towel at exactly the wrong time? Even though most traders and investors know better, they still often chase returns and buy at the top, and also bail and sell at exactly the wrong time too. We also got into more detail on the specifics of our trading strategies, and our continuing confidence in our models and trading process.
This Week: Technical Warning, Lookout Below?

Please share this article – Go to very top of page, right hand side, for social media buttons.
The market has recently reached a 12-week low, and some traders are increasingly nervous. We highlight several technical trading indicators that may be flashing warnings signs, and then get into our specific model trades for the week.
One such “technical warning sign” is the ominous head and shoulders pattern that is forming in the S&P 500. According to Patti Domm:
A so-called head and shoulders pattern looks to have formed in the S&P 500, a sign to some technical analysts the market has reached a near-term top and could be heading into a rocky period.
Head and Shoulders chart in the S&P 500
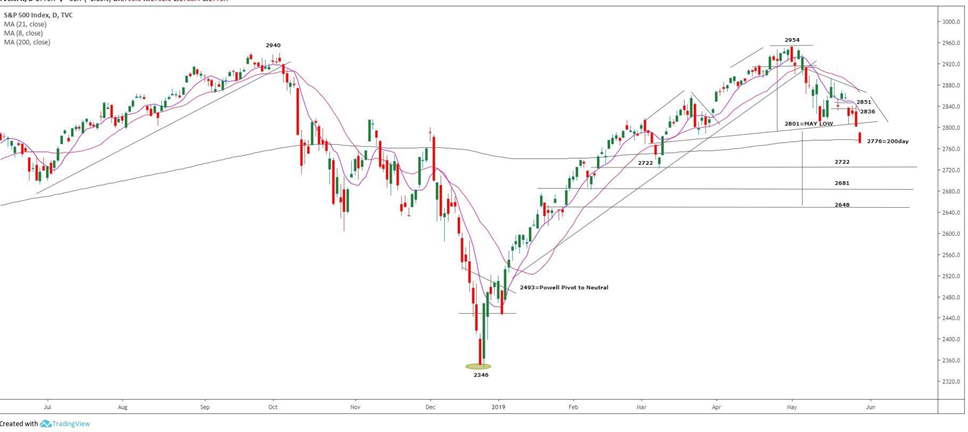
Patti’s article also notes that
“Bank of America Merrill Lynch analysts said there is downside risk to 2,650, the 50% retracement of the December to May rally.”
Bond Market Warning Signs
The 10-year US treasury continues to slide in an indication that market participants may be increasingly nervous (treasuries are a “risk off” asset, meaning investors buy them when they’re afraid, thereby driving up prices and driving down yields). According to Vildana Hajric and Jeremy Herron:
The yield gap between three-month and 10-year Treasuries, often watched as an early signal of pending recession, slid to a 2007 low of minus 13 basis points.
The 200-Day Moving Average
The 200-Day moving average is another technical indicator to watch. This metric is followed by many traders, and the market has a history of bouncing off this average, but when it breaks below, it can be “look out below!”
The market (as measured by the S&P 500) currently remains above this key technical support level, but is continuing to close in on it in recent trading sessions.
What Does History Say?
Chris Ciovacco offers some good perspective on the current market sell off. Ciovacco writes:
It is very difficult to label the current 4.87% correction as out of the ordinary, especially after a sharp multi-month rally. Given the data and news cycle are subject to change in the coming days and weeks, we will continue to take it day by day, respecting the possibility of a major stock market top.
Model Performance:
Our trading programs have moved back to normal trading and cash levels, after having been holding higher levels of cash in challenging market conditions around the turn of the year. And, we are sharing the performance of our proprietary trading models, as our readers have requested.
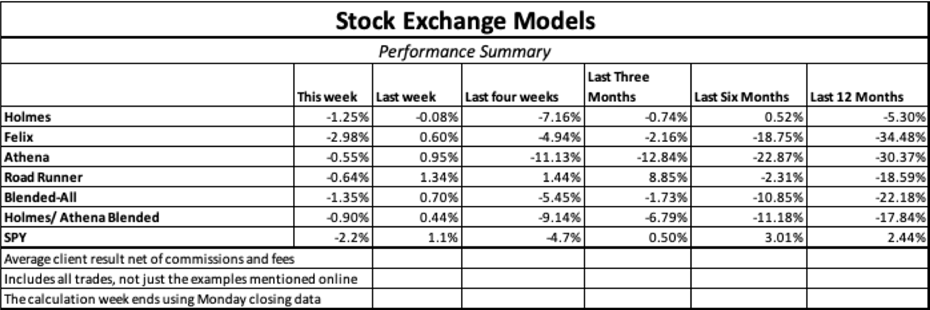
Note that we have changed the timeframe from Tuesday to Monday, to Wednesday to Tuesday, with the goal of more closely matching the release of this weekly report.
For more information about our models (and their specific trading processes), click through at the bottom of this post for more information (readers are additionally invited to write to main at newarc dot com for our free, brief description of how we created the Stock Exchange models).
Expert Picks From The Models:
Note: This week’s Technical Thoughts report is being moderated by Blue Harbinger, a source for independent investment ideas.
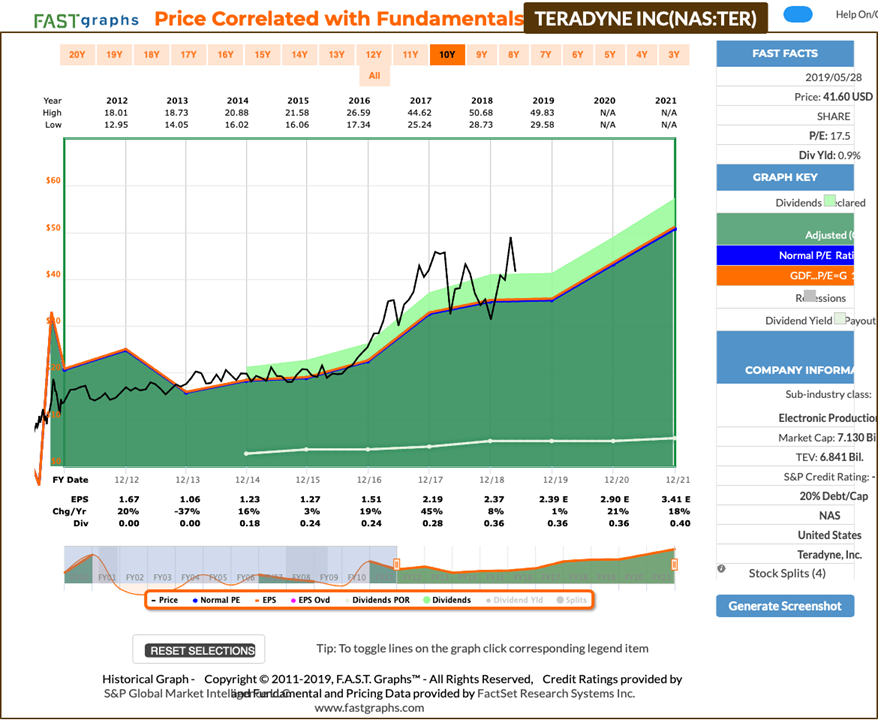
Holmes: This week, I bought shares of Teradyne (TER). What do you think about that, Blue Harbinger?
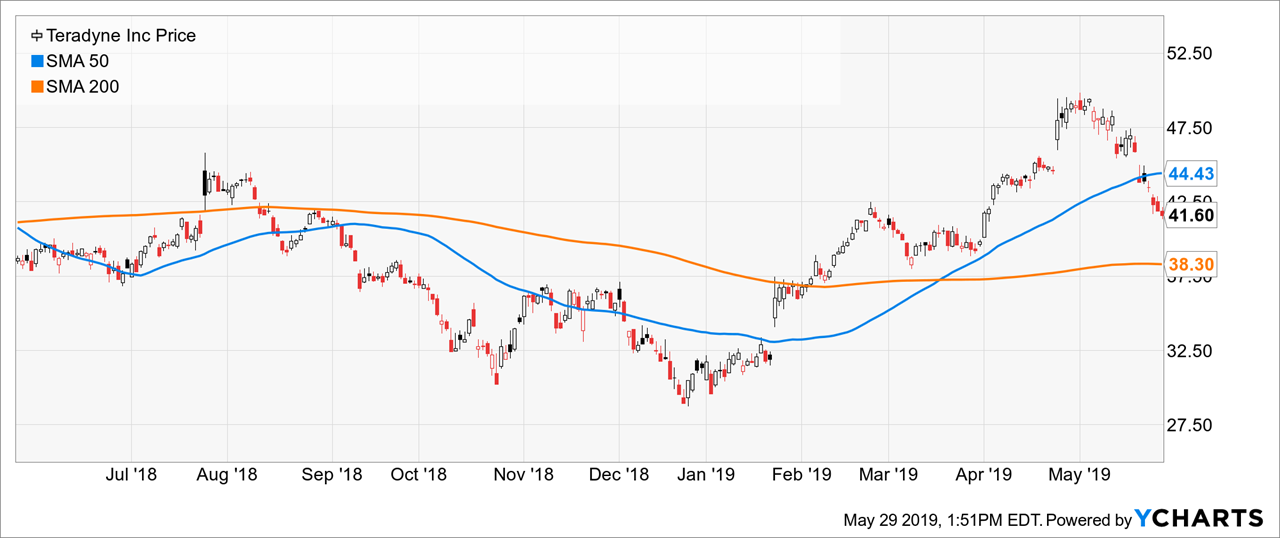
Blue Harbinger: Don’t they make semiconductor test equipment? It seems like a risky time to buy considering that sector seems to be significantly impacted by the US-China trade war. Why’d you buy?
Holmes: I use a mean-reversion approach to identify stocks that have moved “abnormally” far from their recent price history. Teradyne seems to have done that and I also identified the additional conditions necessary for me to purchase, which occurred this week. As always, market conditions may impact this trade, but since these mean-reversion stocks are often at a low recent price point, they are generally less impacted by negative market conditions.
BH: Thanks for that explanation. I know you typically only hold for around 6-weeks, but here is a look at some longer-term fundamental data if you’d like some additional data points to consider
Road Runner: This week I bought Zoetis (ZTS). As you know, I like to buy stocks in the lower end of a rising channel.
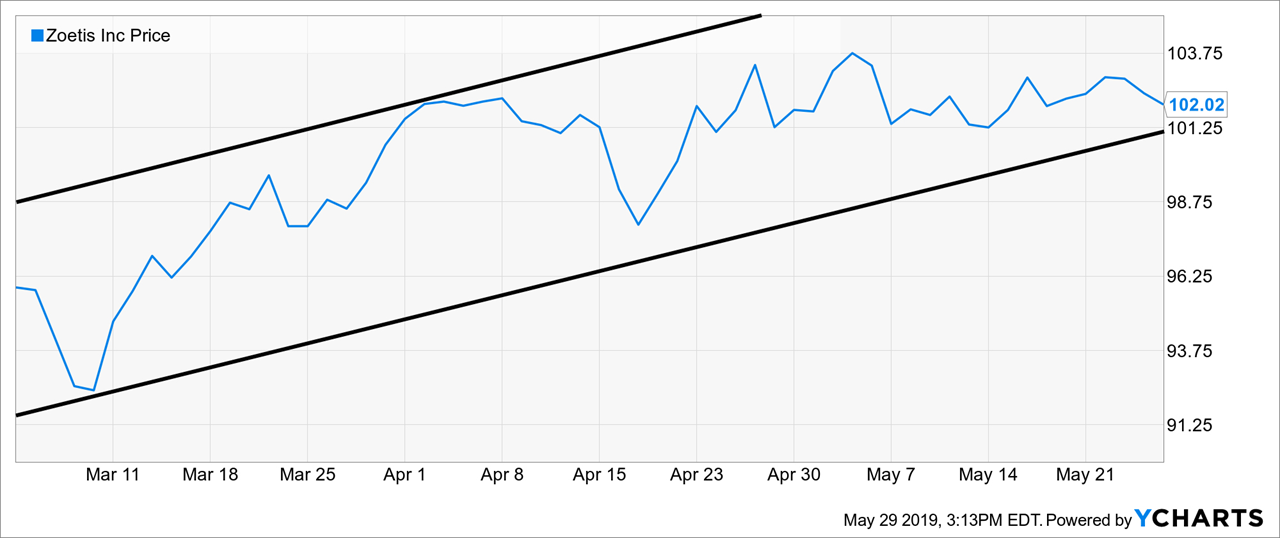
BH: I do know that because you tell me that almost every week, but can you provide a little more color?
RR: As we’ve discussed previously, I look for a certain type of situation (some call it a pattern, others may call it a setup, etc.) where the probability of a particular action is not a matter of chance (50/50) but has been historically noted to result in a greater tendency towards a particular outcome. “Trending in a channel” is one such situation. An equity will often “cycle” between the upper and lower bounds of that channel for substantial periods of time. My model design attempts to take advantage of this property by identifying stocks trending in an upwards channel and waiting until the stock price drifts to the lower bound, making it a candidate for purchase. These types of situations have a relatively high probability of positive outcome with a reasonable profit potential. ZTS can be seen to be in this type of a situation. Now I know you may try to point out some fundamental data, but I don’t really care. This is a short-term trade that has traditional shown profitability when the right conditions have been met. One way or another, I’ll be out of it shortly – usually after about 4 weeks.
BH: Thanks for that explanation. And how about you, Athena – do you have any trades to share this week?
Athena: I bought shares of Tandem Diabetes Care (TNDM) this week.
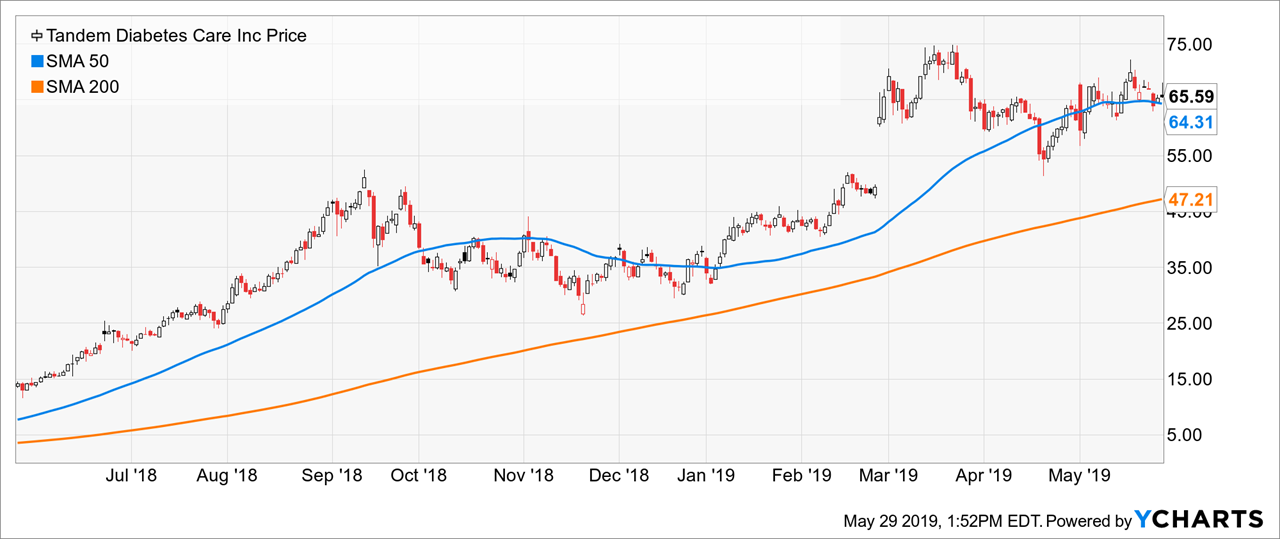
BH: Well, the healthcare sector has been a relative laggard this year, and it’s supposed to be a little defensive during market turbulence, so I suppose this could be a decent trade. Why’d you buy Athena?
Athena: My modus operandi is to look for stocks having strong positive trends and then selecting only those with the very strongest trends (“king of the hill”), constantly replacing the ones with weaker trends. It should not surprise anyone that I’m holding TNDM. A quick look at the chart makes the strength of the trend for obvious. And I will continue to hold TNDM until either the strength of the trend abates or if a stock with an even higher trend strength comes along. I don’t have a set “holding period” for a position. I will exit only when either a stronger stock comes along or if market conditions dictate a strong potential for loss – capital preservation remains the key driver in all situations.
BH: Thanks Athena – that is interesting stuff. And how about you, Felix – anything to share this week?
Felix: I have a ranking to share. This week, I ran the stocks of the Nasdaq 100 through my technical trading model, and my top 20 are ranked in the following list.
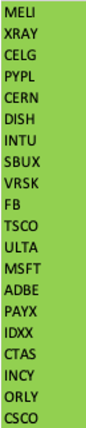
BH: I see you like Mercado Libre (MELI). However I am guessing this is not a bet on the fundamental’s of this Latin American online commerce platform. I know you are a momentum-based technical model, and I can see these shares have been delivering very strong performance for months. Thank you for sharing.
Conclusion:
Our models continue to actively place trades, despite the recent market pullback. However, we are also monitoring the overall technical conditions of the market closely as capital preservation remains a key driver of our trading activity. The growing technical warnings signs are important to monitor, but they should also be taken with a grain of salt considering they’re often mainly media-driven. We continue to believe strongly in our trading models, and we continue to prudently place trades based on our trading objectives.
Getting Updates:
Readers are welcome to suggest individual stocks and/or ETFs to be added to our model lists. We keep a running list of all securities our readers recommend, and we share the results within this weekly “Stock Exchange” series when feasible. Send your ideas to “etf at newarc dot com.” Also, we will share additional information about the models, including test data, with those interested in investing. Suggestions and comments about this weekly “Stock Exchange” report are welcome. You can also access background information on the “Stock Exchange” here.
Trade alongside Jeff Miller: Learn more.
.


