by Lance Roberts, Clarity Financial
One of the reasons given for the push to new highs, and something we had previously said was highly probable, were the “better than expected” earnings reports coming in.

Please share this article – Go to very top of page, right hand side, for social media buttons.
As noted by FactSet:
“Percentage of Companies Beating EPS Estimates (78%) is Above 5-Year Average
Overall, 15% of the companies in the S&P 500 have reported earnings to date for the first quarter. Of these companies, 78% have reported actual EPS above the mean EPS estimate, 5% have reported actual EPS equal to the mean EPS estimate, and 17% have reported actual EPS below the mean EPS estimate. The percentage of companies reporting EPS above the mean EPS estimate is above the 1-year (76%) average and above the 5-year (72%) average.”
Wow…that’s impressive and certainly would seem to be the reason behind surging asset prices.
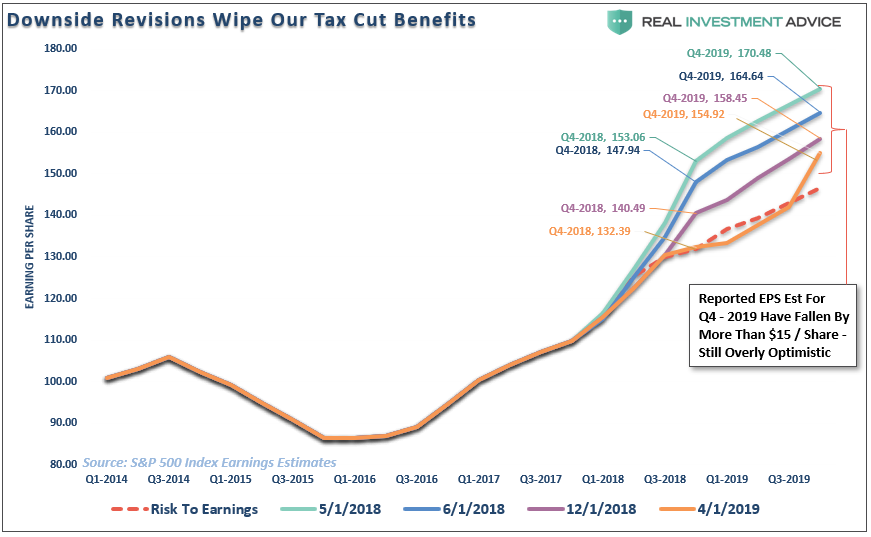
The problem is that “beat rate” was simply due to the consistent “lowering of the bar” as shown in the chart below:
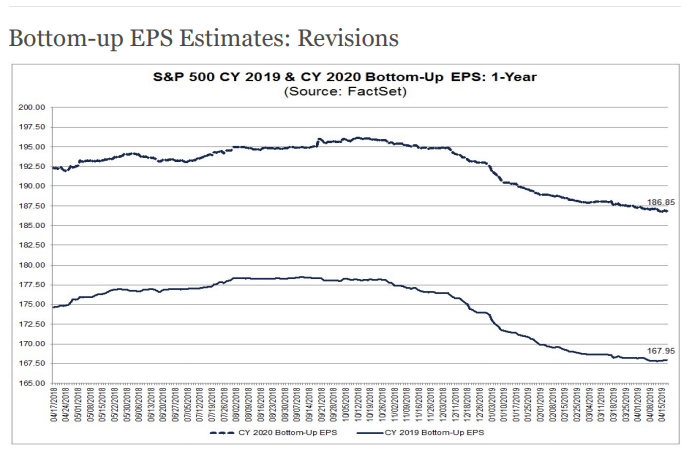
As shown, beginning in mid-October last year, estimates for both 2019 and 2020 crashed.
This is why I call it “Millennial Soccer.”
Earnings season is now a “game” where scores aren’t kept, the media cheers, and everyone gets a “participation trophy” just for showing up.
Here is the problem for unwitting investors.
- Assume you buy company XYZ at $100 based on forward earnings estimates of $10/share. (FWD PE=10)
- Not a bad bargain.
- However, before earnings season begins, analysts drop their estimates to $5/share. (PE=20)
- Not so good of a bargain.
- Company reports earnings of $5.01/share which beat earnings expectations and everyone cheers.
- Unfortunately, you way overpaid for the value received.
This is why you really have to do your homework when buying individual companies. The problem with not paying attention and basing your investment decisions on forward “operating” earnings (which is another fictitious Wall Street marketing tool to manipulate earnings) is that consistently overpaying for investments leads to lower long-term returns.
To get a clearer understanding of what is going on with the market currently, let’s take a look at the last fully reported quarter in earnings.
For the entire 2018 reporting year operating earnings per share rose from $124.51 per share in Q4 of 2017 to $151.60 in Q4 of 2018 for a 21.76% annual gain. Reported earnings also rose from $109.88 to $132.39 during the same period for an annualized gain of 20.49%.
That sounds pretty good.
But, before you get all excited, that surge included the benefit of the massive corporate tax reduction. However, those gains aren’t all that noteworthy when you consider that on an annualized basis 2017 operating earnings growth was 17.17% and reported earnings growth was 16.21% which was without the benefit of tax cuts.
Not nearly as exciting as the media made it out to be is it?
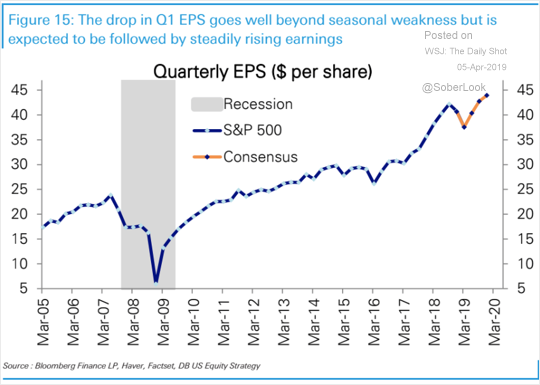
But the slowdown in earnings this quarter, which is expected to be a one-time anomaly before re-accelerating, is coming on the heels of a sharp slowdown in growth in the last two quarters.
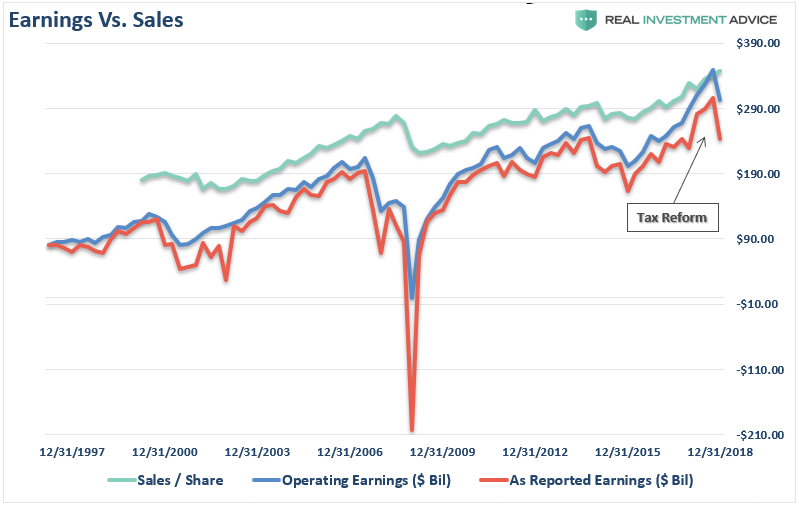
Note that while revenues have not yet turned negative, revenues tend to lag downturns in earnings. It is also worth noting that sharp downturns in earnings preceded the onset of recessions in 2001 and 2008.
More importantly, share buybacks have been doing a good chunk of the lifting for those “earnings beats.” With corporations expected to set a new record in share repurchases again in 2019, the question will become how much “bang for the buck” are they getting?
Since the recessionary lows, much of the rise in “profitability” has come from a variety of cost-cutting measures and accounting gimmicks rather than actual increases in top-line revenue. While tax cuts certainly provided the capital for a surge in buybacks, revenue growth, which is directly connected to a consumption-based economy, has remained muted.
Importantly, since 2009, the reported earnings per share of corporations has decreased from 353% in Q2-2018 to just 285% in Q4. However, even with the recent decline, this is still the sharpest post-recession rise in reported EPS in history. Moreover, the increase in earnings did not come from a commensurate increase in revenue which has only grown by a marginal 56% during the same period. (Again, note the sharp drop in EPS despite both tax cuts and massive share buybacks. This is not a good sign for 2019.)
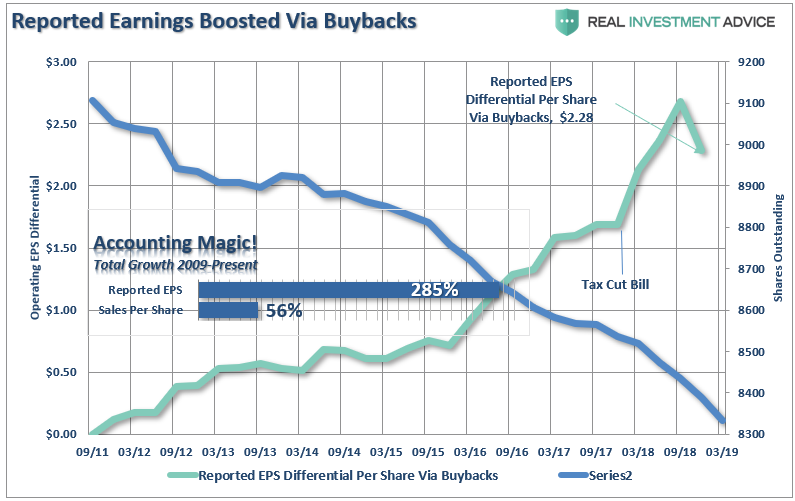
The reality is that stock buybacks create an illusion of profitability. Such activities do not spur economic growth or generate real wealth for shareholders, but it does provide the basis for with which to keep Wall Street satisfied and stock option compensated executives happy.
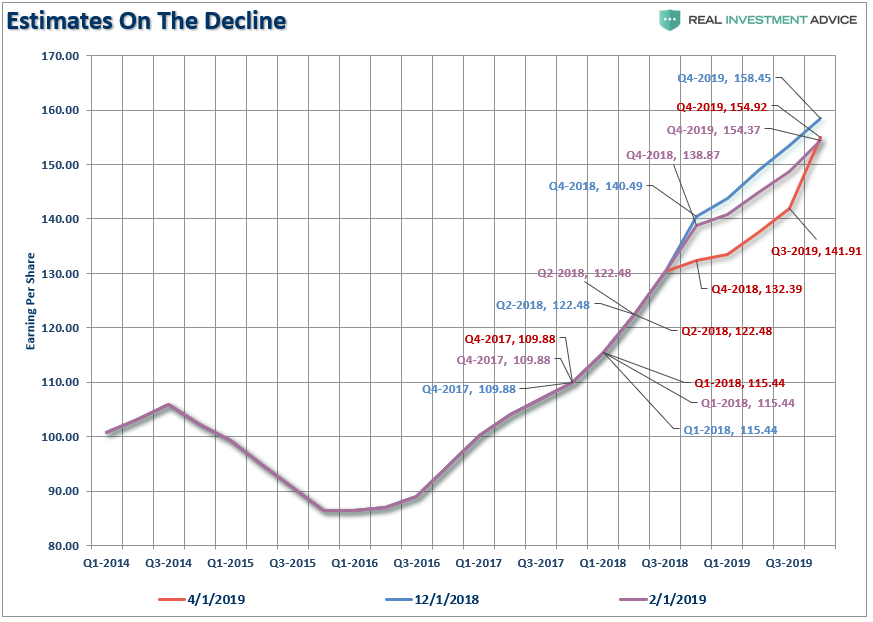
The next chart shows the slide in estimates just since December. Forward expectations have fallen as economic realities continue to impale overly optimistic projections. Just since February, the estimates for the front half of 2019 have plummeted.
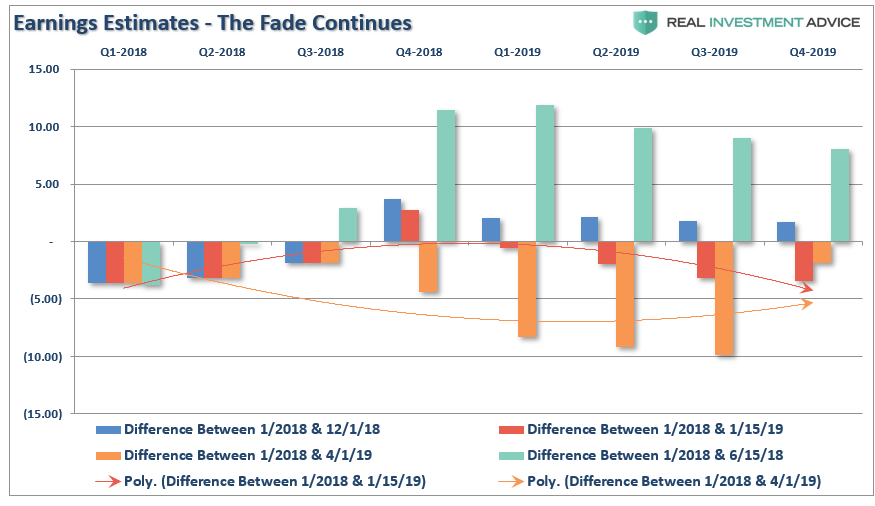
The chart below shows the changes in estimates a bit more clearly. It compares where estimates were on January 1st, 2018 versus June and December of 2018 and January and April of 2019. You can see the massive downward revisions to estimates from June of last year to April of this year. As I stated above, this is why a high percentage of companies ALWAYS beat their estimates. Had analysts been required to stick with their original estimates, the beat rate would be close to zero.
This is the part where I get to say “I told you so.”
In June of 2017, I wrote “The Drums Of Trade War” stating:
“Wall Street is ignoring the impact of tariffs on the companies which comprise the stock market. Between May 1st and June 1st of this year, the estimated reported earnings for the S&P 500 have already started to be revised lower (so we can play the ‘beat the estimate game’). For the end of 2019, forward reported estimates have declined by roughly $6.00 per share.”
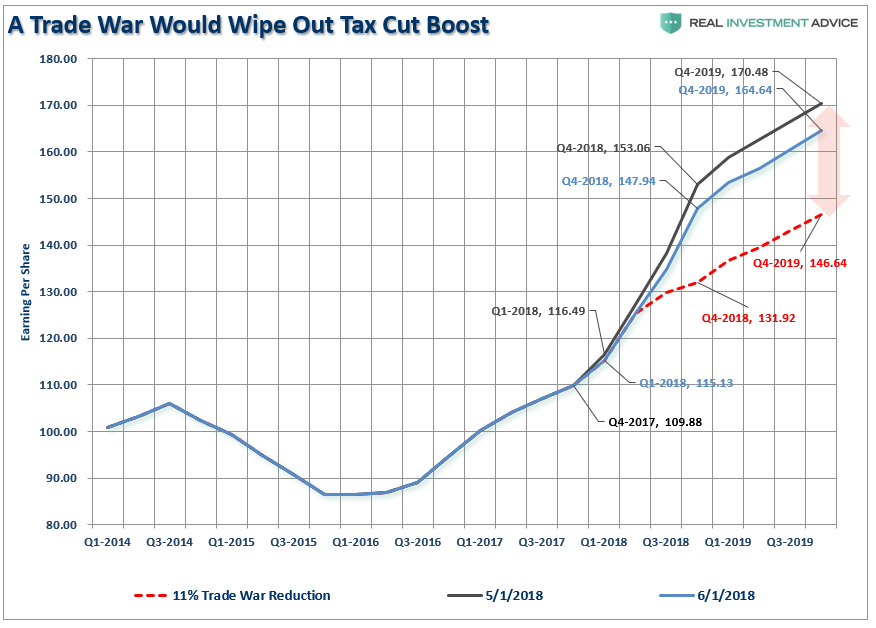
However, the red dashed line denotes an 11% reduction to those estimates due to a ‘trade war’ where an across-the-board tariff of 10% on all US imports and exports would lower 2018 EPS for S&P 500 companies and, thus, completely offset the positive fiscal stimulus from tax reform.”
Surprise! As of the end of the Q4-2018 reporting period, guess where we are? Exactly 11% lower than where we started which, as stated then, has effectively wiped out all the benefit from the tax cuts.
Sadly, as we noted several times in early 2018, the entire piece of legislation to cut corporate taxes was squandered with “Trump’s trade war” which has yet to yield any tangible positive benefits economically speaking.
Importantly, the estimates for the end of 2019 are still too high and will need to revised lower over the next couple of quarters as economic growth remains materially weaker. The burgeoning debts and deficits, corporate and household leverage, and slower job growth will ensure slower growth into year end.
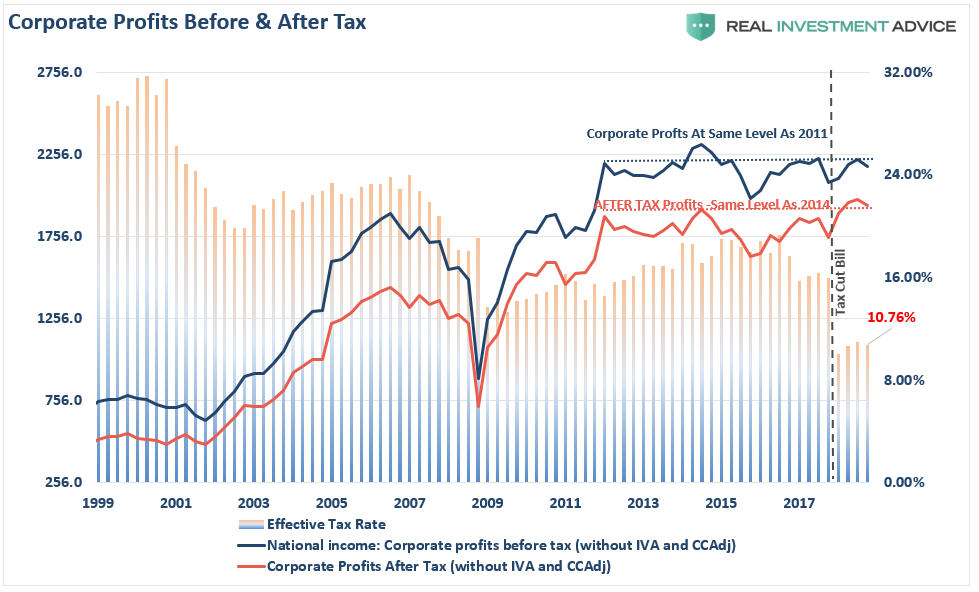
But since we are playing “Millennial Soccer,” let’s look at data which is devoid of a lot of the manipulation. Corporate profits, rather than earnings, is what is reported to the Internal Revenue Service for taxation purposes. It strips out the accounting gimmicks found in operating earnings, share buybacks, and other obscuring factors.
While stock prices have surged to all-time highs, corporate profits remain at the same level as they were in 2011 on a pre-tax basis, and 2014 on a post-tax basis despite the massive drop in tax rates.
As I noted Thursday:
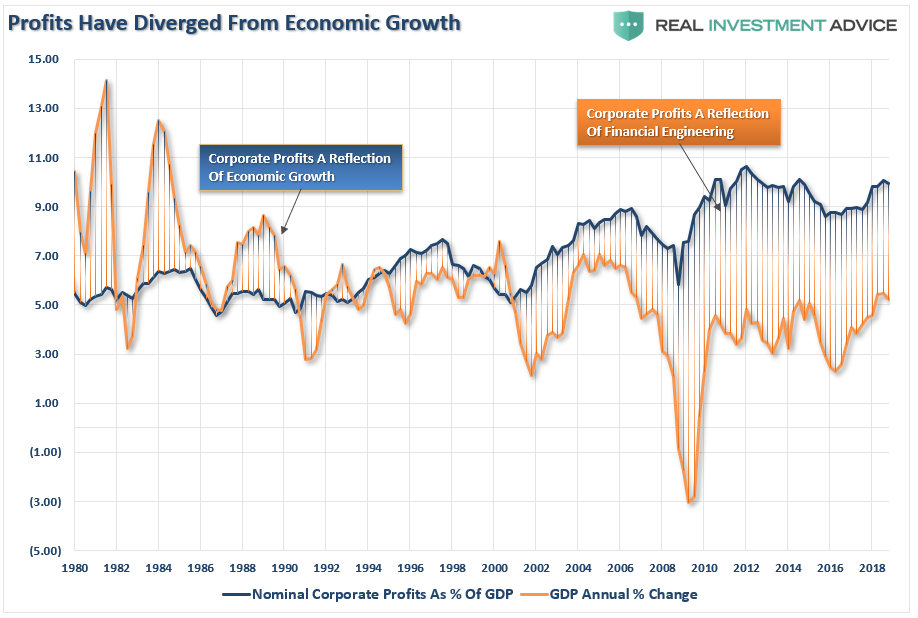
“While the WSJ is correct that corporate profits now 10% of GDP, up from 6-8% prior to the turn of the century, there are two factors worth noting.
- Corporate profits are very diverged from economic growth which is contributing to the wealth inequality issue.
- The profit/GDP ratio is still lower than it was in 2010-2011 despite the massive boost from tax cuts, $1 trillion in deficit spending, and a booming stock market.”