by UPFINA
Article of the Week from UPFINA
There have been several phase changes in this 10 year expansion, but the changes have been placid historically speaking. This expansion is a few months away from being the longest since the 1800s. How should investors be viewing this?

Please share this article – Go to very top of page, right hand side, for social media buttons.
Speaking of the 1800s, that’s when perma bears would have had a field day as economic growth was way more volatile. As you can see from the chart below, even the 2008 financial crisis is nothing close to the recessions/depressions in the 1800s and early 1900s. The perma bears are living in the wrong century.

Saying that we are in a new era of booms and busts because of the huge stock market collapses in 2000 and 2008 is simply incorrect. We are in a new era of placidness, not a new era of unpredictability. To be clear, it’s possible that stocks will fall as much as they did in the past two recessionary bear markets again. The 2008 financial crisis was the worst recession since the Great Depression, but from 1870 to the Great Depression there were 6 deeper recessions.
Could Housing Starts Spike?
The March housing starts and permits report was disappointing. As we mentioned in a previous article, it pushed the Atlanta Fed’s estimate for real residential investment growth down from 4% to 3.5%. Even with the decline in interest rates, starts and permits were weak.
The charts below imply starts might jump soon, helping Q2 real residential investment growth.

The chart on the right shows the number of “new homes sold, but not yet started” has increased. It’s not a logical leap to expect starts to increase after “houses sold, but not started” increase. Furthermore, the number of new home inventories that have not yet started has spiked substantially. Therefore, new home inventories under construction should increase soon. The inventory of potential starts and the demand for new homes signal a rebound in the housing market in the next few months.
Weak Existing Home Sales Report
On top of the weak housing starts and permits report, the March existing home sales report was also weak. Existing home sales don’t add to GDP, but they do account for about 90% of the housing market, making them an important indicator of the health of the housing market. As you can see from the chart below, seasonally adjusted annualized existing home sales were 5.21 million which was down from 5.48 million and missed estimates for 5.3 million.
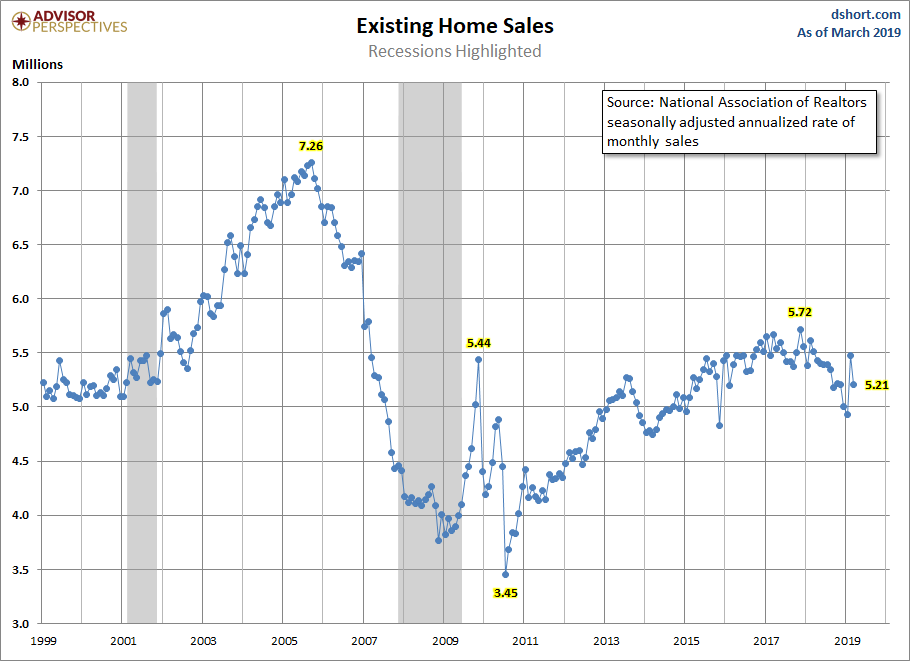
This reading was just above the low end of the consensus range which was 5.2 million. On a monthly basis, growth was -4.9% which is the opposite of the 11.2% growth in February. Yearly growth fell from -2.3% to -4.9%.
The good news is because this report was stronger than December, the 3 month average of 5.207 million was up 1.4% monthly. The 3 month average peaked at 5.563 million in December 2017, showing us how far the housing market has fallen. The median selling price of existing homes increased 3.7% monthly to $259,400. However, the yearly increase was only 3.8% which signals prior price growth was weak. Housing supply increased 3.1% to 1.68 million which increased inventory from 3.6 months to 3.9 months. Anything below 5 months is considered a tight housing market.
Monthly sales in all regions fell. The Midwest had the weakest monthly growth region as purchases fell 7.9%. Purchases fell 10.7% on a yearly basis in the West. First time home buyers as a percentage of the housing market increased from 32% to 33%. We think the housing market will improve this year because of the strong labor market, which is throwing off high real wage growth, the weakness in home price growth, and the decline in mortgage rates.
Bidding Wars Less Prominent
Bidding wars for houses are much less prominent in 2019 than they were from 2016 to mid-2018 as the chart below shows. This reflects the transition from a sellers’ market to a buyers’ market.

From the start of 2016 to mid-2018, somewhere between the high 40s and the low 60s percentage of offers on houses for sale faced bidding wars. Now the percentage is only in the mid-teens. San Jose is the most expensive housing market. It is one of the hot Western cities like Seattle and Denver. As you can see, at times in the past few years over 90% of offers in San Jose faced bidding wars. San Jose price growth is still high, but it has fallen from 13.9% in Q2 2018 to 11.4% in Q4 2018. We wouldn’t be surprised if price growth fell in Q1 2019.
Big 2 Weeks Of Earnings
The week of April 22nd and April 29th are the biggest of Q1’s earnings season. On April 25th, 64 S&P 500 firms report results. On May 1st, 48 firms report results. So far, the results have been solid which is a good sign. The collapse in earnings estimates in the first 2 months of the year was overdone. The latest results which include the first 104 firms to report show that 79% have beaten EPS estimates on 6.17% growth and 55% have beaten sales estimates on 4.27% growth.
As of April 22nd, when 79 firms had reported results, the average guidance change was -1.63%. That’s worse than the 3 year average of -0.61%, but way better than last quarter’s decline of 3.15%. 28% of firms had their estimates raised which is below the 3 year average of 34%. 48% had them lowered which is slightly lower than the 3 year average of 49%. The estimate for Q2 earnings growth fell from 5% on January 1st to 2.33% on March 1st. As of April 22nd, estimates are for 1.65% growth. This shows how the estimate decline has moderated substantially. That being said, because estimates are usually cut, the estimates will point to negative Q2 growth soon.
The table below breaks down the changes to Q2 estimates by sector.
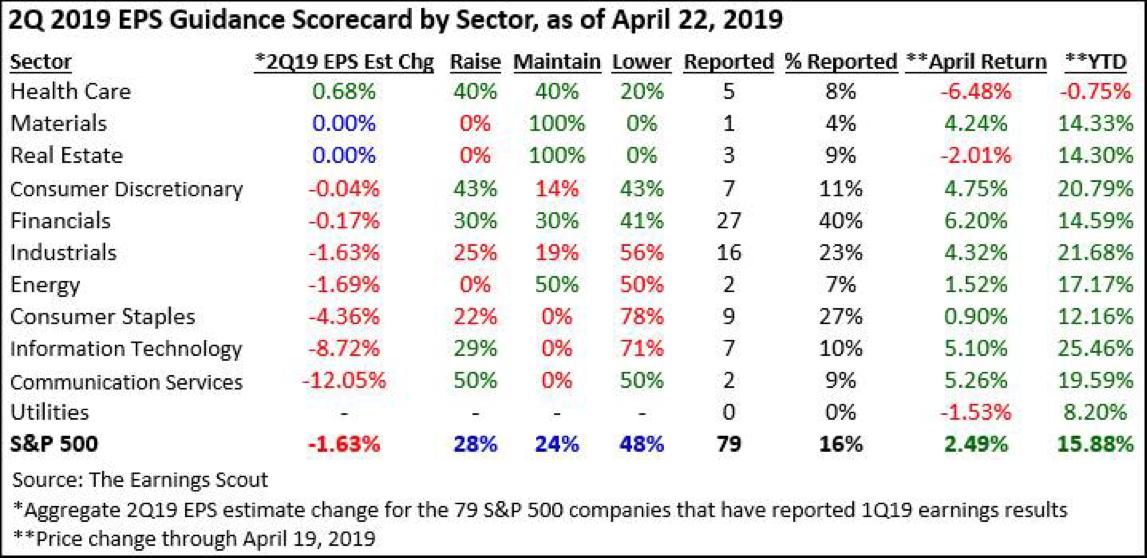
The financials have reported the most results, while 0% of utilities have reported earnings. Amazingly, healthcare has the best Q2 EPS change at positive 0.68%, yet its year to date returns are the worst at -0.75%. The bear market in Q4 priced in the weakness in tech and communication services earnings which is why they have rallied this year despite negative revisions. The obvious question is if this rally undoes what the bear market priced in.
Conclusion
Since the Great Depression, the economy has been placid compared to the 1800s. The housing market has been weak, but starts could spike in the next few months; the overall trend could reverse because housing has gotten more affordable recently. The next 2 weeks are the most important for earnings season. The initial results look promising.
.


