by UPFINA
It’s not popular to say the IPO (initial public offering) market isn’t signaling the stock market is in a bubble, because who wants to click on an article that says there’s nothing to see here? All we care about is finding the truth. What’s interesting is that more people are interested in supporting their existing preconceptions of reality than they are to question them.

Please share this article – Go to very top of page, right hand side, for social media buttons.
Most people believe they have already discovered their version of the truth, and its very difficult to change their opinion if data shows their previous views may be incorrect. But that is our only purpose, to seek the truth, as the data shows, whatever it may be, without letting our preconceptions hold us back from discovering it.
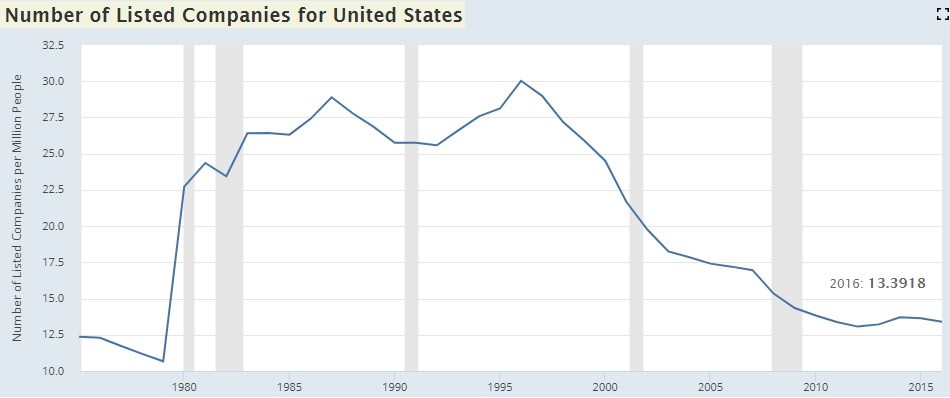
IPO data can be manipulated to support whatever narrative you want. It’s best to just show all the data and allow the truth to emerge. Many bears/skeptics complain that the number of public companies has fallen below that of the late 1990s. That could mean competition has fallen as industries become centralized. As you can see from the chart below, the number of publicly listed companies per million people has fallen.
Source: FRED
The bearish investors complain about the low number of public companies while they also claim the market is in a bubble because the percentage of IPOs with below 0 EPS has been increasing. According to the chart below, which was made by Jay R. Ritter, the percentage of IPOs making no money is at a record high.
However, the skeptics can’t have it both ways. Either you have money losing companies going public like in the 1990s or have fewer firms go public. A huge swath of the tech IPOs in the 1990s weren’t profitable. The best way to increase the number of companies is to have the money losers go public.
The best response to this line of reasoning would be: “why not have a increase in public companies that are profitable?” That wouldn’t necessarily be a bad thing. The issue who is to say what is a high number of public companies? We mostly think we have a low number of them because of the high amount in the 1990s. It’s not as if there is a dearth of startups; there are just more private ones than in the 1990s. Skeptics complain about these firms being private, but then when we see their financials, they complain they aren’t good enough to be public.
Very few investors would decide to buy all of the new IPOs in a year. It’s best to be very selective about which IPO you buy because the sellers know more than you. There are many failures for every company that succeeds. You don’t need to buy your favorite newly public company right away. There’s no rush. Keep in mind, you’re the last investor that is investing in the business, at a much higher (usually) valuation than everyone else who got in before you.
Since no one is buying all the IPOs, this analysis is used to test the level of speculation in the market. It’s important to keep in mind that an elevated percentage of IPOs losing money doesn’t mean as much if there are less IPOs. In the near term, the increase of IPOs in the spring of 2019 simply means volatility has been low. Companies that wanted to go public in Q4 2018 likely delayed their filing because the market was cratering, and because of the government shutdown which delayed regulatory filings.
In the intermediate term, the IPO market isn’t showing signs of euphoria like in the late 1990s. According to Modest Proposal on Twitter, of the 82 U.S. listed IPOs in 2018 with market caps above $500 million (excluding ADRs), 33% were net income positive and another 8.5% were free cash flow positive while having negative net income. Of the money losing firms, 40% were biotech/pharmaceuticals and 30% were software as a service firms.
Relatively Normal IPO Market: Not Much Euphoria
134 firms had their IPO in 2018. The peak this cycle was 206 in 2014. The best equal weighted performance of these IPOs on their first day was in 2013 where IPOs had 21.1% returns. The 18.9% returns in 2018 were 1% above average. In 1999, 476 firms had their IPO and the first day returns were 71.2%. That was an extreme bubble. We aren’t even elevated now.
Source: Modest Proposal
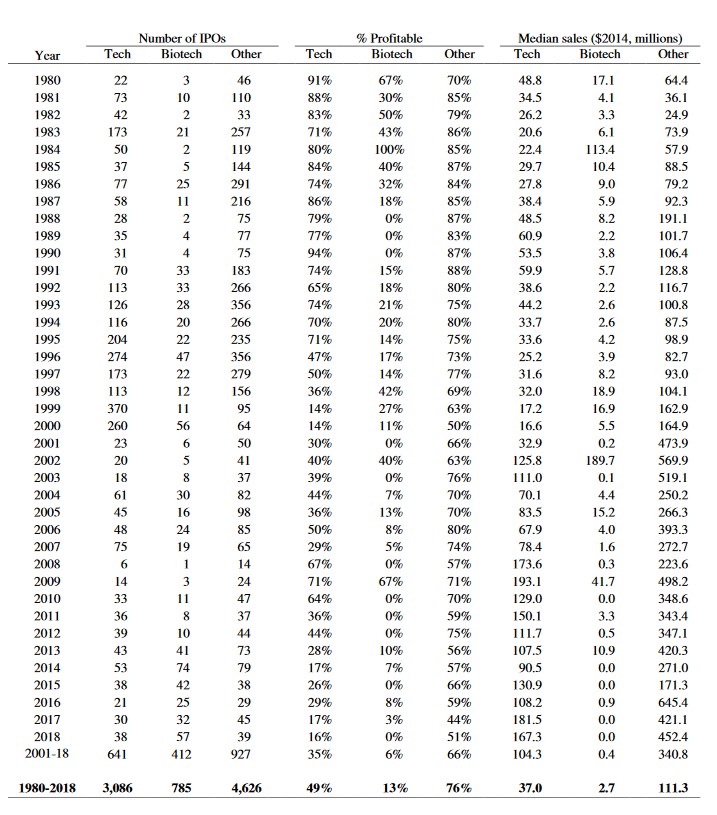
Tech companies that are doing their IPOs now are older and less profitable than average, but their sales multiples aren’t near the tech bubble days. As the table below shows, 16% were profitable in 2018 which is below the average of 49%. In 1999, 14% were profitable. However, there were 38 tech IPOs in 2018 as compared to 370 in 1999. There isn’t much of a frenzy going on.
Source: Modest Proposal
The median first closing day price to sales ratio in 2018 was 11.3 which is above the 6.9 average, but miles below the peak of 49.5 in 2000. While these firms are valued more expensively than average, they are bigger and older. These aren’t fly by night companies. The median age in 2017 and 2018 was 13 and 12 years, respectively. The average is 7 years old. In 1999, the median age was only 4. In 2014 dollars, tech firms had $167.3 million in sales in 2018 as compared to just $16.6 million in 1999.
This table makes tech look fine and other firms look great, but biotech look worrisome. 51% of the other 39 firms were profitable at their IPO. Biotech doesn’t look good as 0% of the 57 IPOs were profitable in 2018 and they only had 2014 median sales of $400,000.
Conclusion
The IPO market isn’t as frothy as some suggest. There aren’t as many IPOs as in the 1990s. Even if they are money losers, it’s not a big deal. The biotech group looks problematic, but you shouldn’t make a broad assertion of the stock market based on 57 biotech IPOs that weren’t profitable in 2018.
.


