Written by Lance Roberts, Clarity Financial
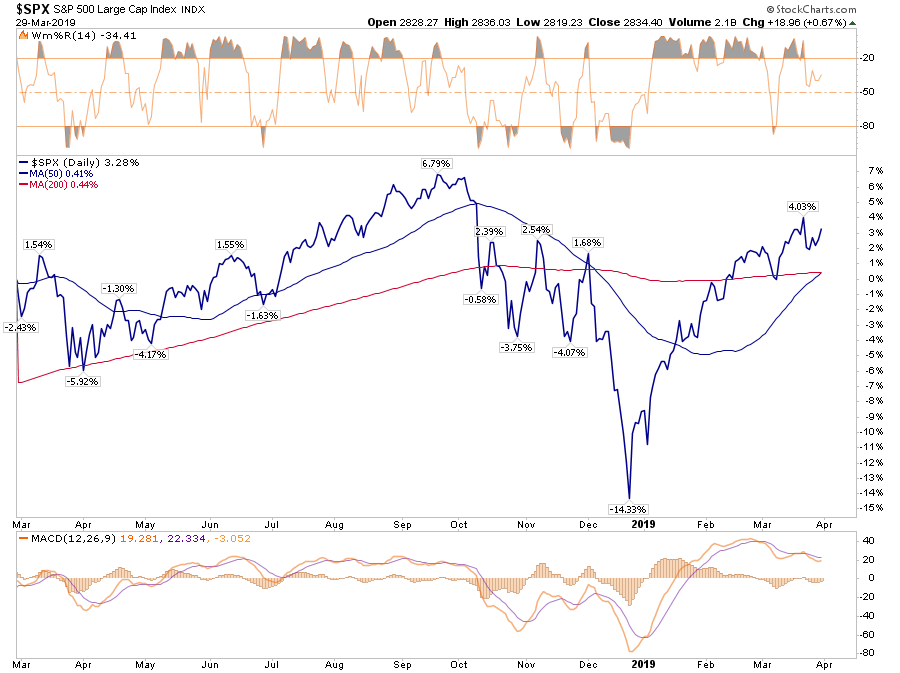
Friday wrapped up the first quarter of 2019, and it was the best quarterly performance since 2009. As shown in the chart below, if you bought the bottom, you are “killing it.”

Please share this article – Go to very top of page, right hand side, for social media buttons.

However, you didn’t.
Despite all of the media “hoopla” about the rally, the reality is that for most, they are simply getting back to even over the last year.
That is, assuming you didn’t “sell the bottom” in December, which by looking at allocation changes, certainly appears to be the case for many.
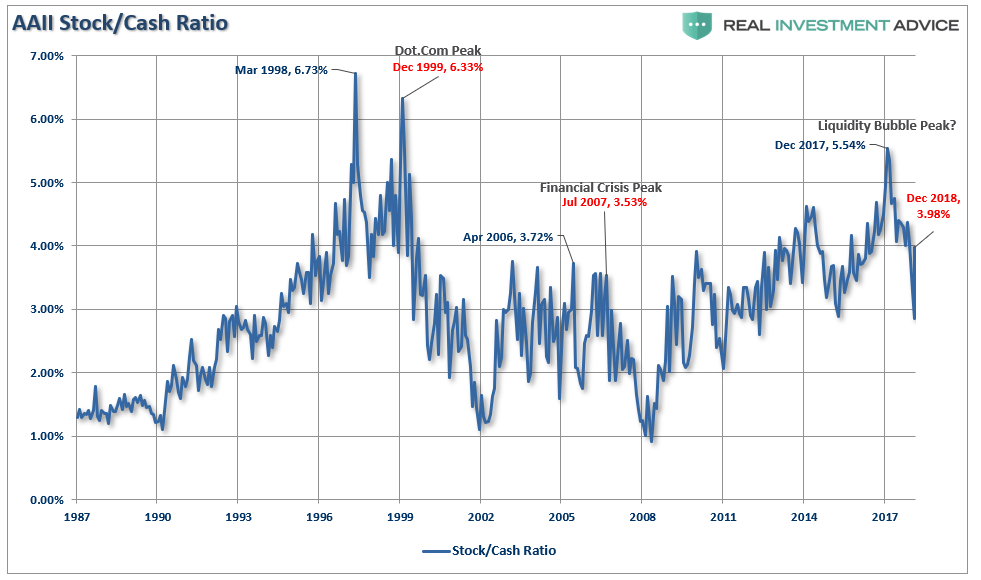
If we deconstruct the ratio we can see the rotation a bit better
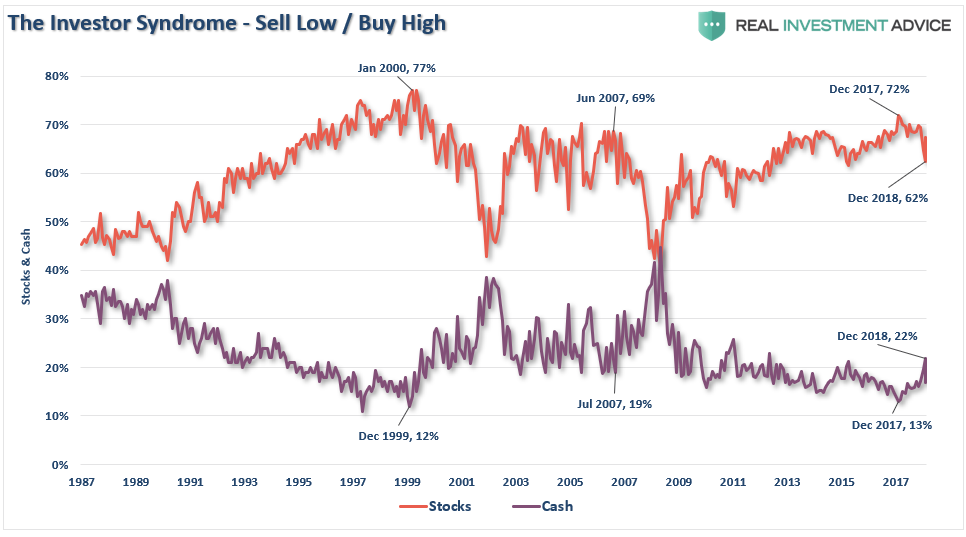
Not surprisingly, historically speaking, investors had their peak stock exposure before the market cycle peak. As the market had its first stumble, investors sold. When the market bounces, investors are initially reluctant to chase it. However, as the rally continues, the “fear of missing out or F.O.M.O” eventually forces them back into the market. This is how bear market rallies work; they inflict the most pain possible on investors both on the bounce and then on the way back down.
However, for the moment, we are still in the midst of a bear market rally. This will be the case until the market breaks out to new highs. Only then can we confirm the previous consolidation is complete and the bull market has been re-established.
The good news is on a very short-term basis, the market IS INDEED bullishly biased and coming off an extremely strong first quarter rally. The current momentum of the market is strong as bullish optimism has regained a foothold.
But, as we noted for our RIA PRO Subscribers last week, (Free 30-Day Trial with Code: PRO30) complacency has moved back to extremes which suggests that a further rally isn’t “risk free.”
“The graph below is constructed by normalizing VIX (equity volatility), MOVE (bond volatility) and CVIX (US dollar volatility) and then aggregating the results into an equal-weighted index. The y-axis denotes the percentage of time that the same or lower levels of aggregated volatility occurred since 2010. For instance, the current level is 1.91%, meaning that only 1.91% of readings registered at a lower level.
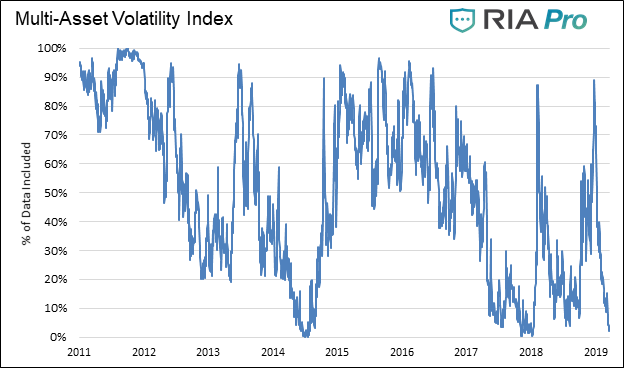
“Beyond the very low level of volatility across the three major asset classes, there are two other takeaways worth pondering.
The peak -to- trough -to- peak cycle over the last year was measured in months not years as was the case before 2018.
Secondly, when the index reached current low levels in the past, a surge in volatility occurred soon after that. This does not mean the index will bounce higher immediately, but it does mean we should expect a much higher level of volatility over the next few months.”
Nonetheless, the markets are close to registering a “golden cross.” This is some of that technical “voodoo” where the 50-day moving average (dma) crosses above the longer-term 200-dma. This “cross” provides substantial support for stocks at that level and limits downside risk to some degree in the short-term.
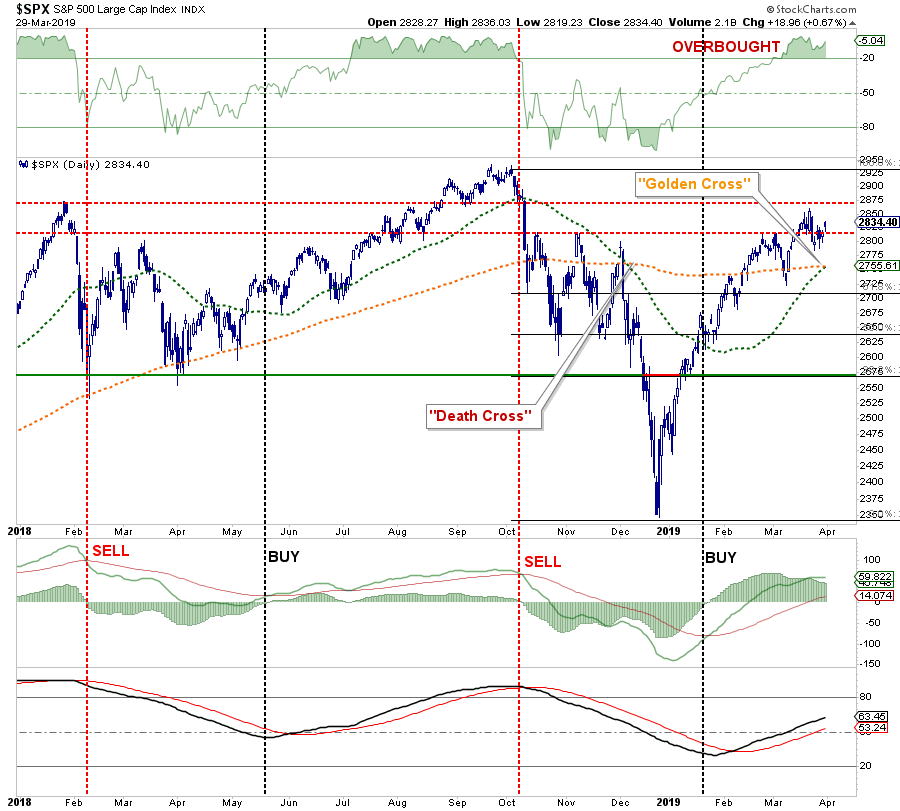
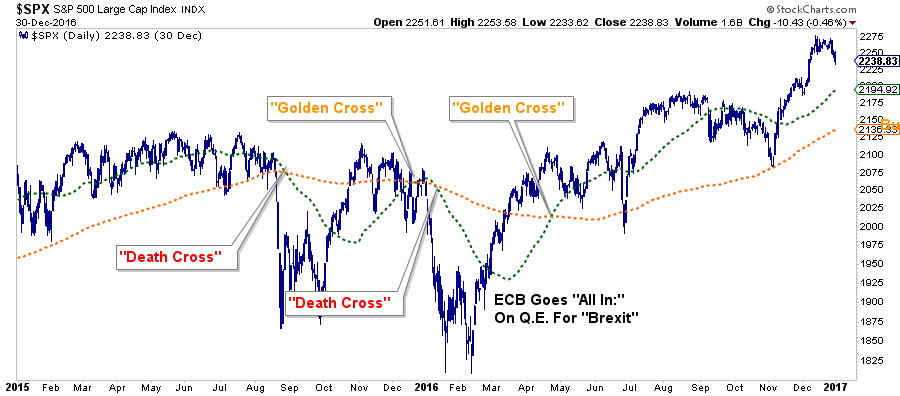
Over the next couple of weeks, you are going to see a LOT of commentary about “the Golden Cross” buy signal and why this means the “bull market” is officially back in action. While “golden crosses” are indeed bullish for the markets, they are not an infallible signal. The chart below shows the 2015-2016 market where investors were whipsawed over a 6-month period before massive Central Bank interventions got the markets back on track.
The next chart shows the longer-term version of the chart above using WEEKLY data. The parameters are set for a slightly longer time frame to reduce the number of “false” indications. I have accentuated the moving averages to have them more clearly show the crosses.
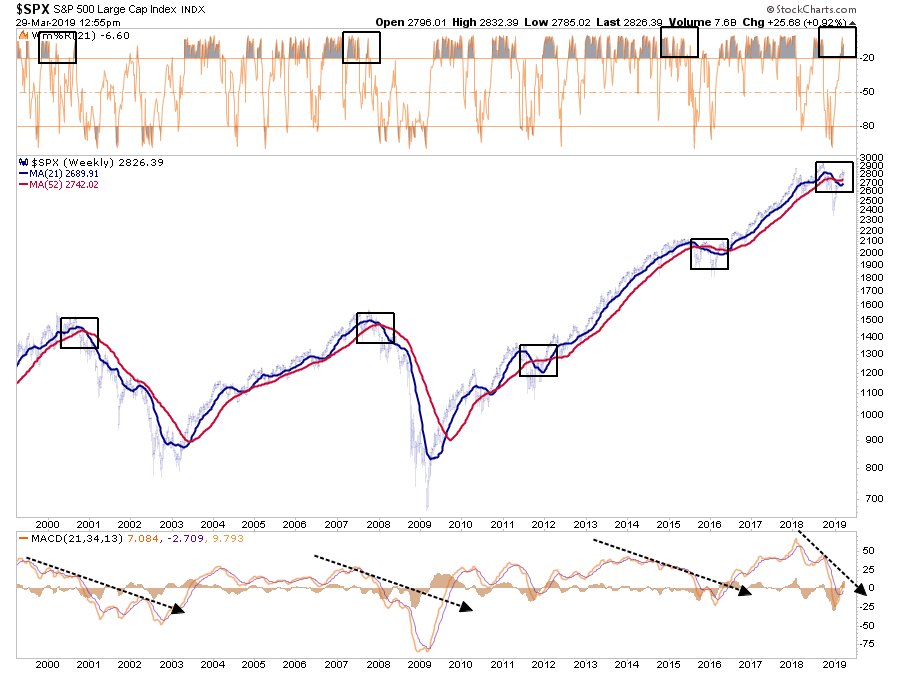
The one thing that you should notice is the negative “cross over” is still intact AND it is doing so in conjunction with an extreme overbought weekly condition and a “negatively diverging” moving average divergence/convergence (MACD) indicator. This combined set of “signals” has only been seen in conjunction with the previous market peaks. (As noted, the corrections of 2012 and 2015-16 were offset by massive amounts of Central Bank interventions which are not present currently.)
From a portfolio management standpoint, what should you do?
In the short-term the market remains bullishly biased and suggests, with a couple of months to go in the “seasonally strong” period of the year, that downside risk is somewhat limited.
Therefore, our portfolio allocations:
- Remain long-biased towards equity risk
- Have a balance between offensive and defensive sector positioning
- Are tactically positioned for a trade resolution (which we will sell into the occurrence of.)
However, the analysis also keeps us cautious with respect to the longer-term outlook. With the recent inversion of the yield curve, deteriorating economic data, and weaker earnings prospects going forward, we are focused on risk management and capital controls. As such we are:
- Continuing to carry slightly higher levels of cash
- Overweight bonds
- Have some historically defensive positioning in portfolios.
- Continue to tighten-up stop-loss levels to protect gains, and;
- Have outright hedges ready to implement when needed.


