Written by Lance Roberts, Clarity Financial
Data Analysis Of The Market and Sectors For Traders

Please share this article – Go to very top of page, right hand side, for social media buttons.
S&P 500 Tear Sheet
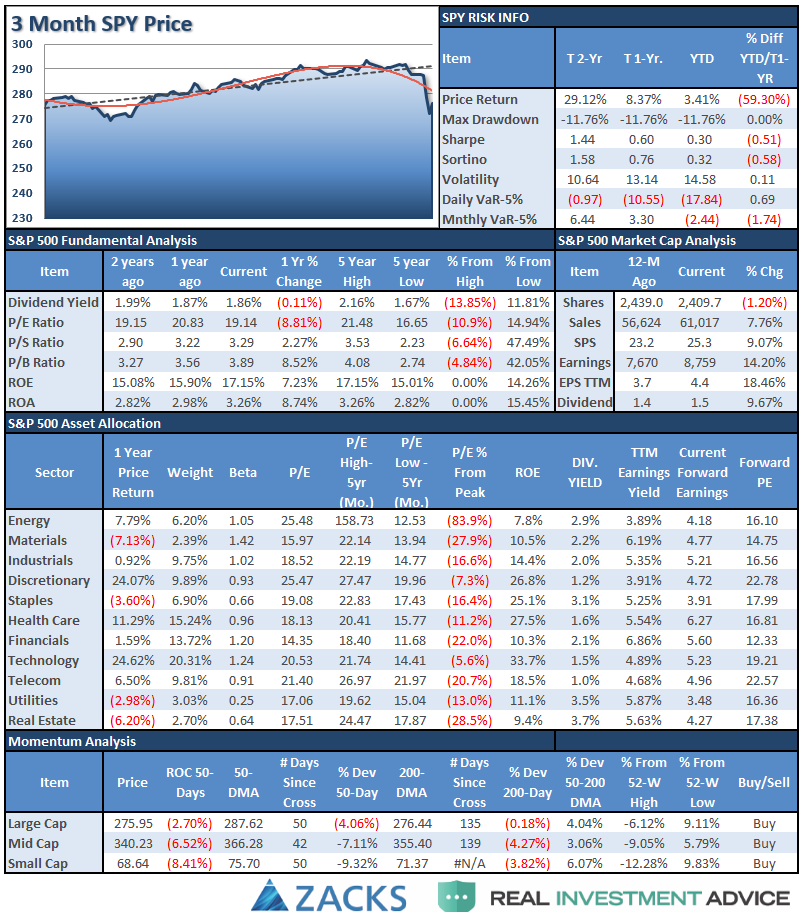
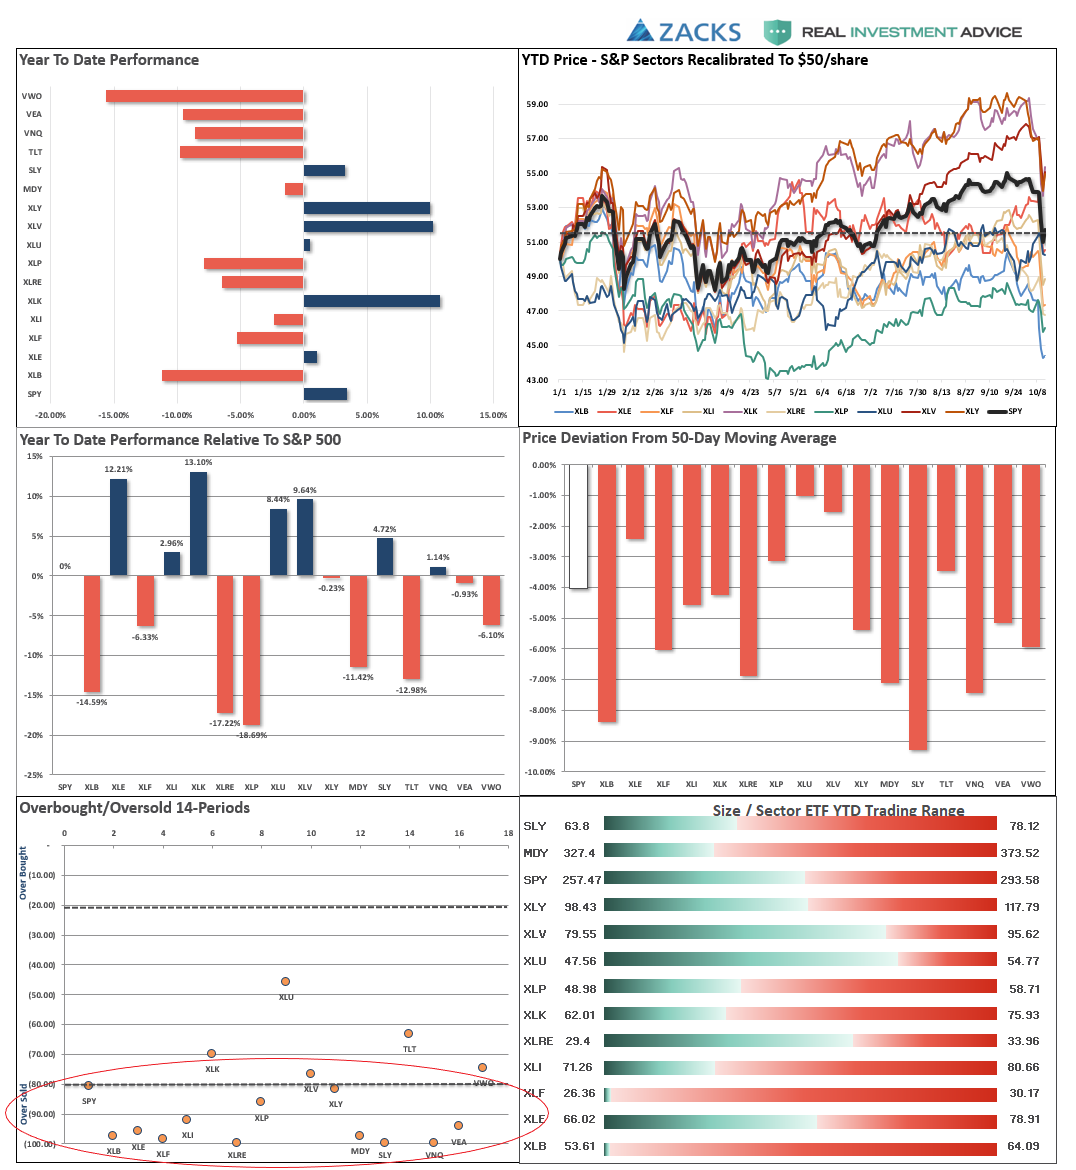
Performance Analysis
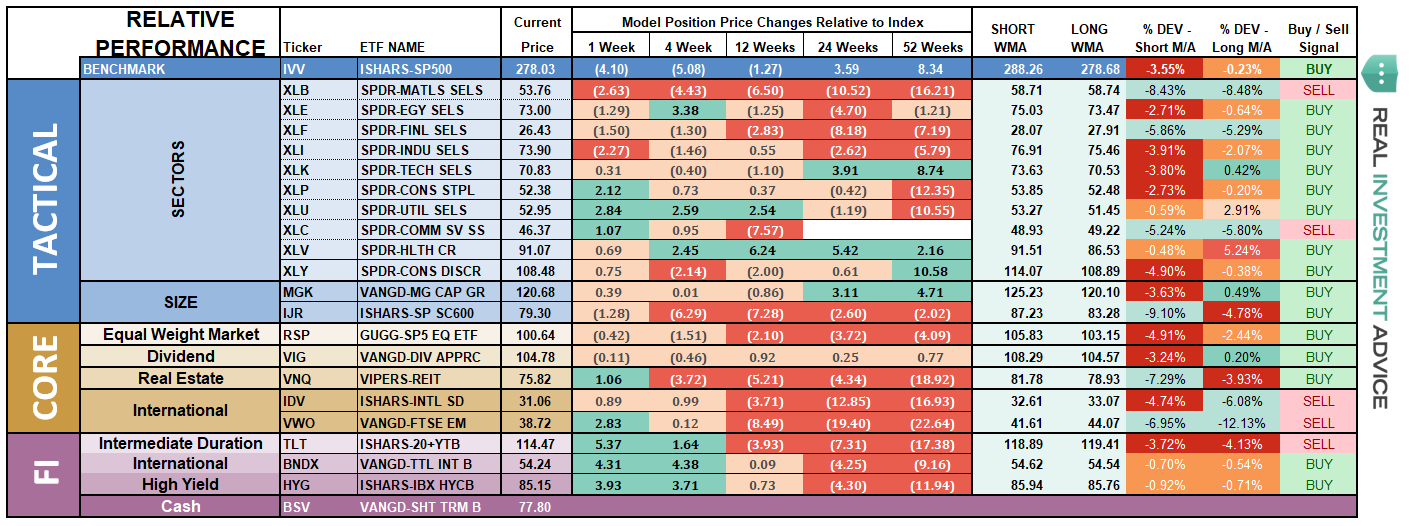
ETF Model Relative Performance Analysis
Sector & Market Analysis:
Everything changed last week as the “bull market” stumbled.
Sector-by-Sector
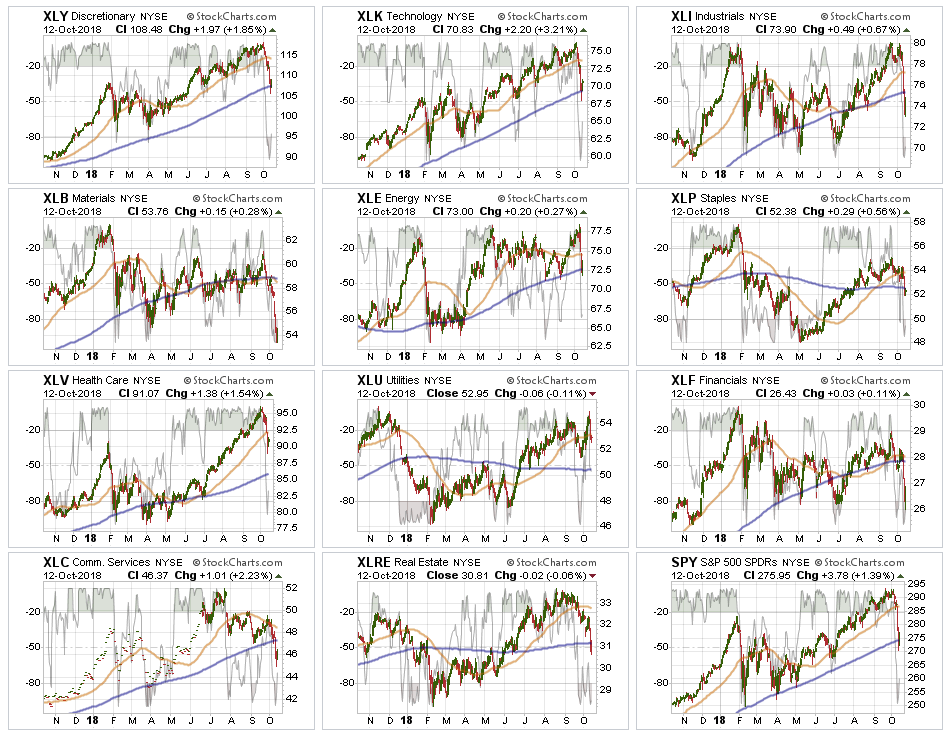
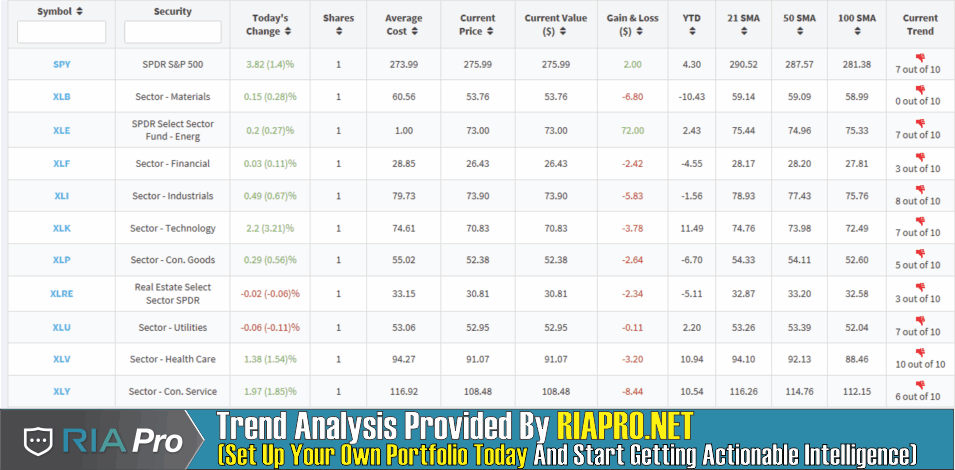
Industrials, Materials, Staples, Real Estate, and Financials all violated their 200-dma last week and failed to recover. Financials are particularly troubling given the decent fundamental backdrop for banks currently. Also, Real Estate finally woke up to the risk of rising rates. These sectors are now in “sell rallies” mode until there is a resumption of a more bullish trend. Basic Materials violated its April lows and all previous stop levels. This sector should be sold on any rally in the coming days.
Discretionary, Healthcare, Energy and Technology violated their 50-dma last week but held their 200-dma support during the recent rout. Energy’s double top suggest a reduction in energy weightings on any rally that fails at the 50-dma in the next few days. Rebalance risk in Healthcare (after a huge run-up), Technology, and Discretionary sectors by rebalancing back to original portfolio weightings.
Utilities – despite breaking the 50-dma last week, the overall trend for Utilities remains very bullish. Look for continued rotation into this sector if market volatility continues.
Telecommunications – with the new reshuffle in this sector could well see a pick up in volatility. There is no reason to add this sector to holdings right now as there simply isn’t enough data yet to determine much of anything from a trading perspective. We will watch this over the next couple of months to see how things develop.
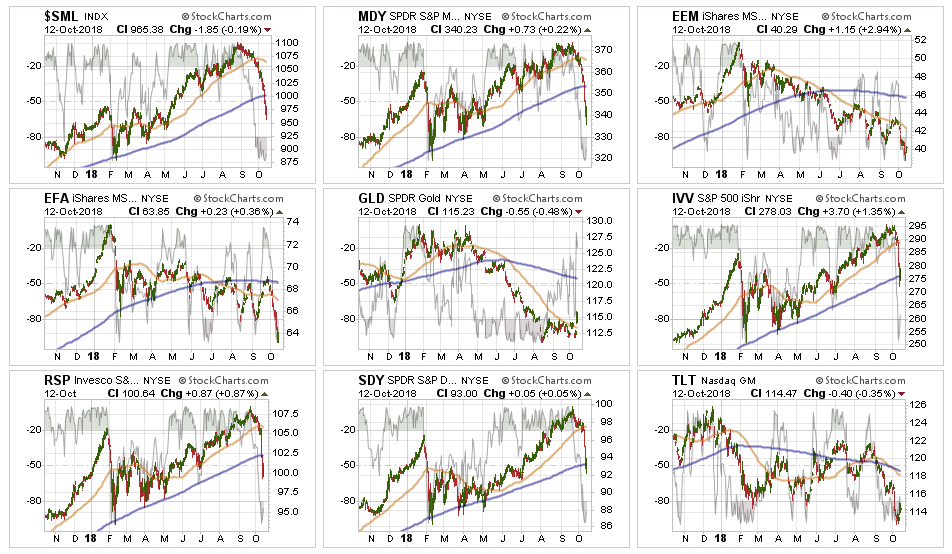
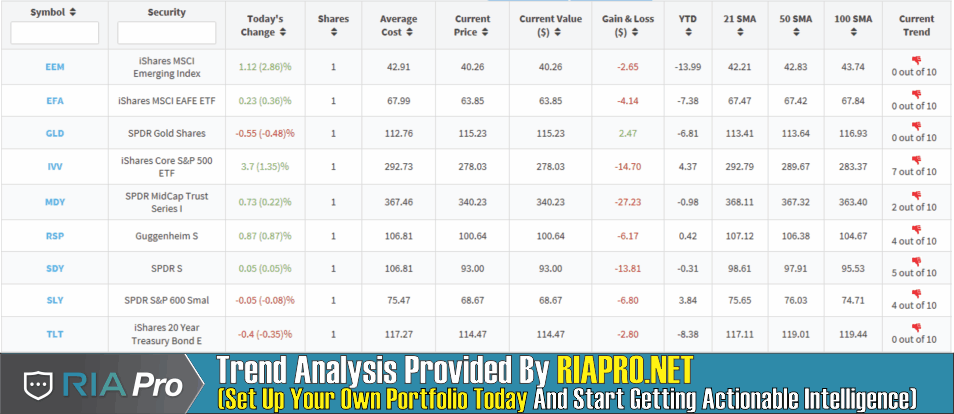
Small-Cap and Mid Cap – the breakdown in small and mid-cap stocks suggest a broader change to the overall market complexion. Last week, both markets violated their 200-dma and their bullish trend lines from February of this year. Sell rallies back to the 200-dma and put stops at the recent lows.
Emerging and International Markets as I noted two weeks ago.
“Both sectors rallied a bit last week, providing an opportunity to reduce exposure for the time being and reallocate that capital to better performing areas. WHEN international and emerging markets begin to perform more positively we will add positions back to portfolios. There is just no reason to do so now.”
This past week, both markets collapsed to new lows. There still remains, since we recommended selling in January of this year, no reason to be long these sectors just yet. If we start to see real improvement, versus a bounce in a downtrend, we will reconsider our weightings.
Dividends, Market, and Equal Weight – The overall market dynamic appears to have changed last week. With the markets deeply oversold short-term look for a rally to reduce risk, rebalance weightings in portfolios, and raise some cash.
Gold – after repeated failures at the 50-dma, the metal finally found some life in the midst of the recent market meltdown. With Gold now extremely overbought short-term, use this rally to sell holdings if you are deeply underwater. From a trading perspective, IF, and this is a big if, Gold can hold the 50-dma on a pullback and turn higher, a rally to the 200-dma is feasible. Such would coincide with a much bigger sell-off in stocks.
Bonds – broke their near-term support at $114 triggering the stop loss on trading positions. However, we are now aggressively buying individual bonds at depressed prices and increasing yield in portfolios. All trading positions are currently closed.
The table below shows thoughts on specific actions related to the current market environment.
(These are not recommendations or solicitations to take any action. This is for informational purposes only related to market extremes and contrarian positioning within portfolios. Use at your own risk and peril.)

Portfolio/Client Update:
This past week was another example of just how fast and brutal sell-offs in the market can be. Importantly, while these sell-offs are brutal we do not want to get emotionally swept up in the moment and “panic sell” a market low.
With the markets holding their 200-dma last week, and hitting 4-standard deviations below the 50-dma, a rare event, we want to give the markets an opportunity to trade back up to previous resistance next week.
Please review the “Checklist Summary Of Actions To Take” in the main missive above. We will be applying this rules to our portfolios as well.
- New clients: We are holding OFF on-boarding into our portfolio models until a better risk/reward opportunity emerges.
- Equity Model: All positions are being reviewed and positions that have violated stop levels will be sold to reduce portolio risk.
- Equity/ETF blended – Same as with the equity model.
- ETF Model: We will reduce small and mid-cap holdings on any rally back toward the 50-dma.
- Option-Wrapped Equity Model – If the market rallies back to previous resistance levels, we will add a long-dated S&P 5oo put option to portfolios to hedge risk.
As we have repeatedly stated, we are well aware of the present risk. However, these violent declines are symptomatic of the liquidity issues posed by the massive surge in passive indexing.
As we have stated previously:
“This is why we ‘step’ into positions initially. Once a ‘trade’ begins to work as anticipated, it is then brought to the appropriate portfolio weight and becomes a long-term investment. We will unwind these actions either by reducing, selling, or hedging, if the market environment changes for the worse.”
This past week, it did.
.


