Written by Lance Roberts, Clarity Financial
Data Analysis Of The Market and Sectors For Traders

Please share this article – Go to very top of page, right hand side, for social media buttons.
S&P 500 Tear Sheet
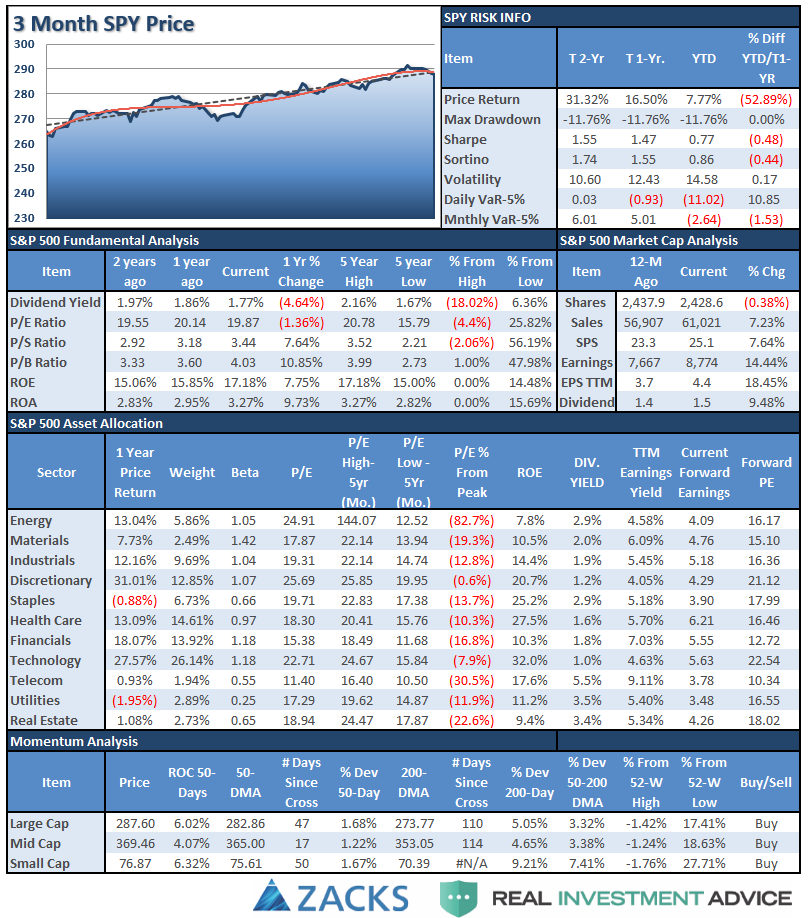
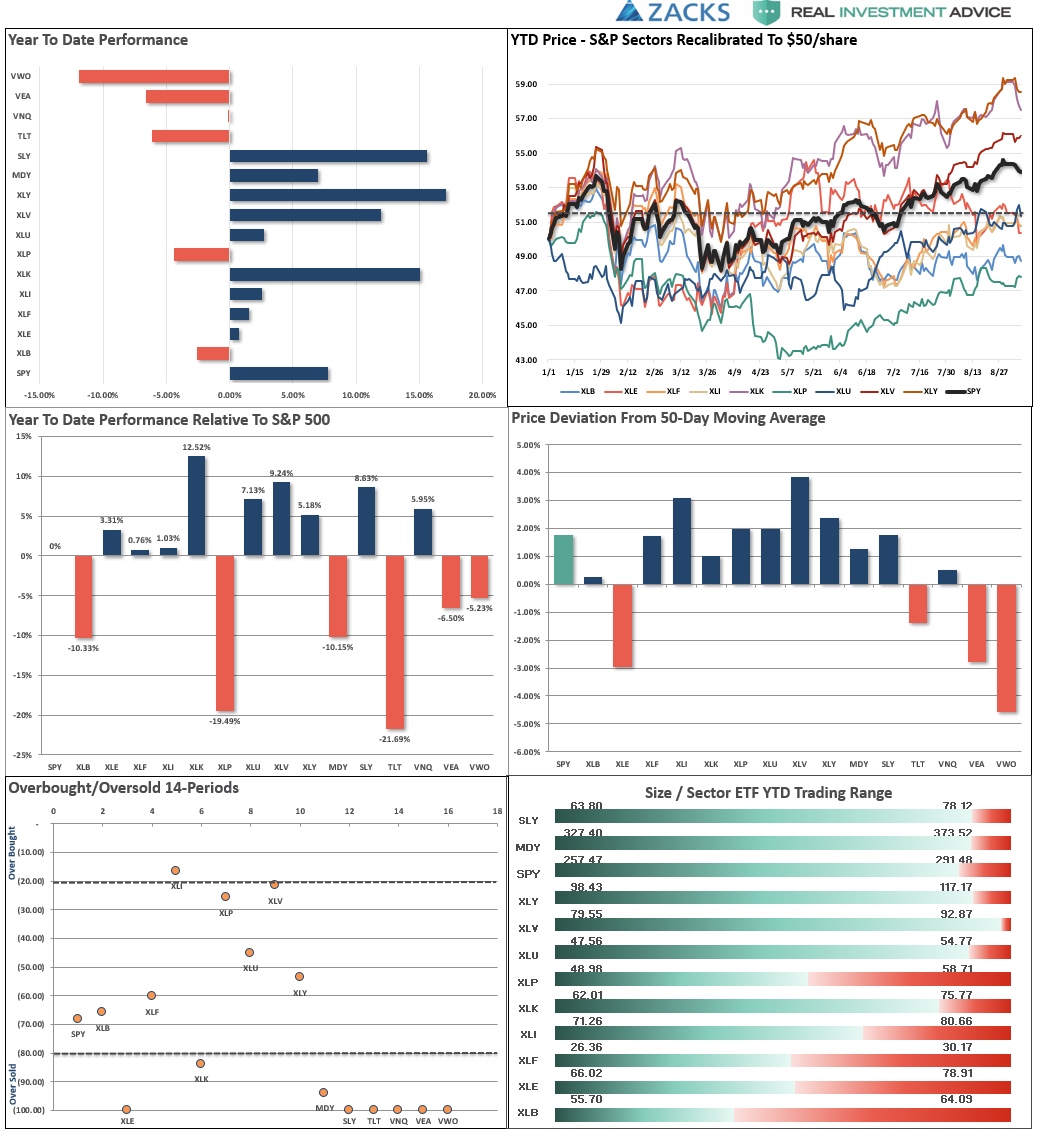
Performance Analysis
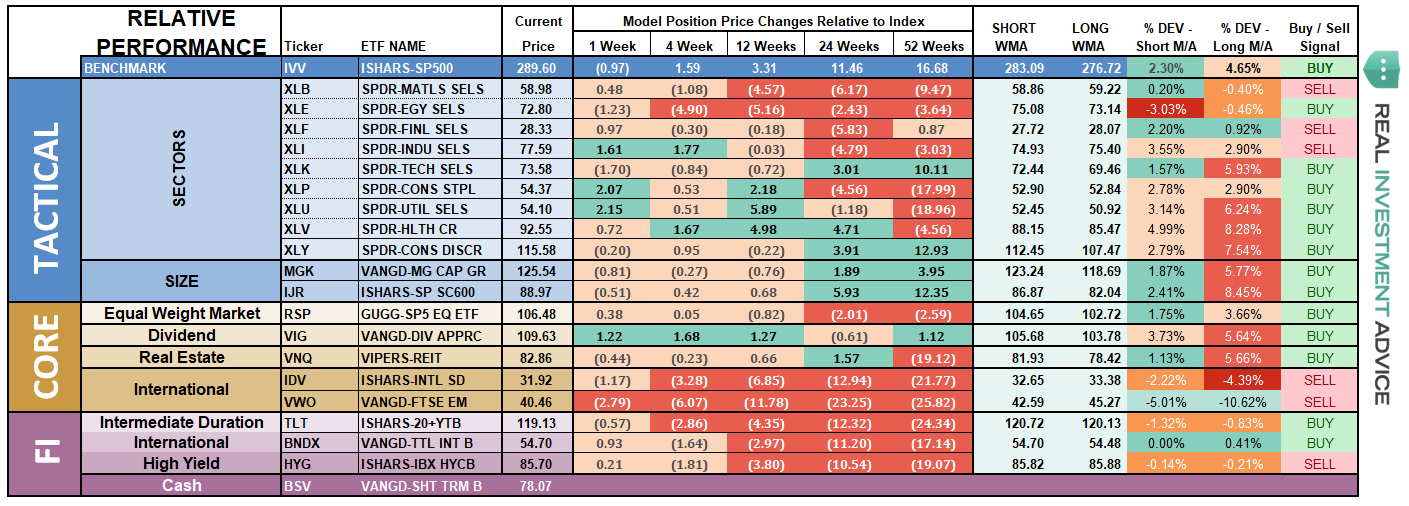
ETF Model Relative Performance Analysis
Sector & Market Analysis:
As I noted last week:
“Despite the markets breaking out to all-time highs last week, there is definitely signs of rotation from previously leading sectors of the market to the laggards. This is shown below in the 10-week relative-rotation graph which compares performance relative to the S&P 500 index.”
That rotation continued this week with two of the more defensive sectors (healthcare and utilities) leading the S&P 500 while the former leaders of Discretionary, Technology, Small and Mid-Capitalization groups slipped from leading to weakening. Staples, Industrials and Financials are improving which suggest more a more defensive rotation will continue into next week.
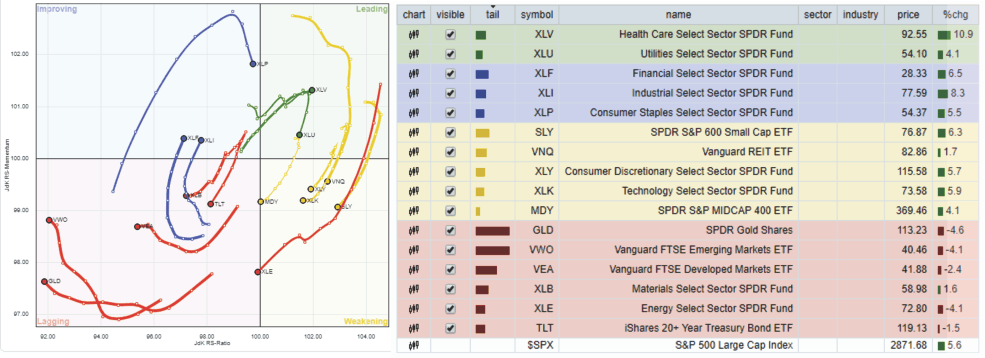
We are watching for a potential entry point for the industrial sector which has begun to improve performance-wise, but we remain wary of the “tariff” risk as the White House and China continue to scale up the rhetoric.
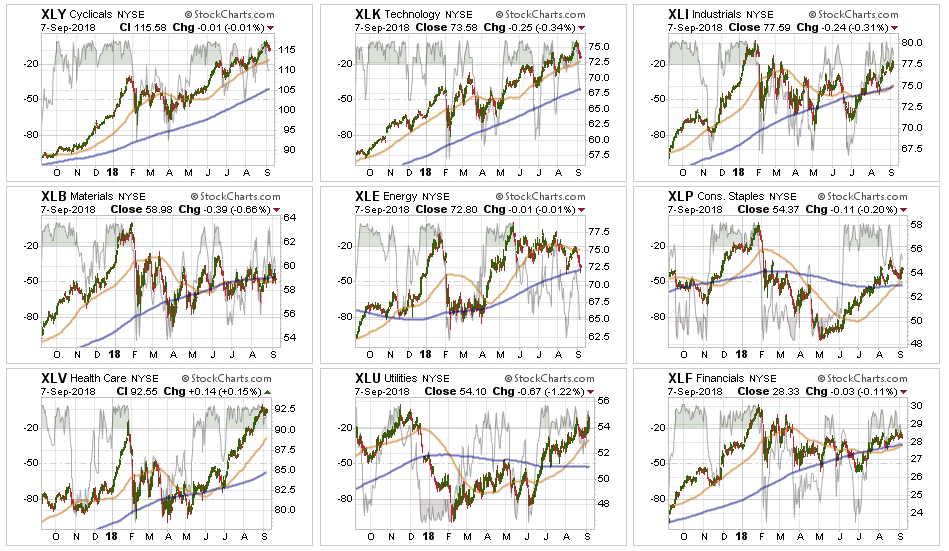
Discretionary, Technology, and Staples – all took a breather last week after a strong previous advance. As we noted last week, this is what was needed before trying to add exposure to these areas.
Healthcare and Utilities – as noted above, maintained their strength after a very tough start to the year. As we stated two weeks ago, there is a movement to more defensive sectors of the market (late economic stage sectors) that is still occurring. Use pullbacks to support, and oversold conditions, to add exposure accordingly.
Financial, Energy, Industrial, and Material – while Industrial finally gained a bit of momentum due to earnings season, the risk of an ongoing, and acceleration of, tariffs and “trade wars” keeps us wary at the moment. However, the recent pick up in performance puts industrials back on our radar and we will look for a short-term oversold condition to add some selective exposure. Energy’s recent slump is again testing the 200-dma after failing at the 50-dma. This is not a positive sign and a break below the 200-dma, which will likely coincide with lower oil prices, will not only impair the sector but flash a bigger concern about the economy. As we stated last week, the 50-dma acted as resistance. Stops should remain at the recent lows. Financials continue to languish along support but not showing much in the way of strength to support overweighting the sector currently.
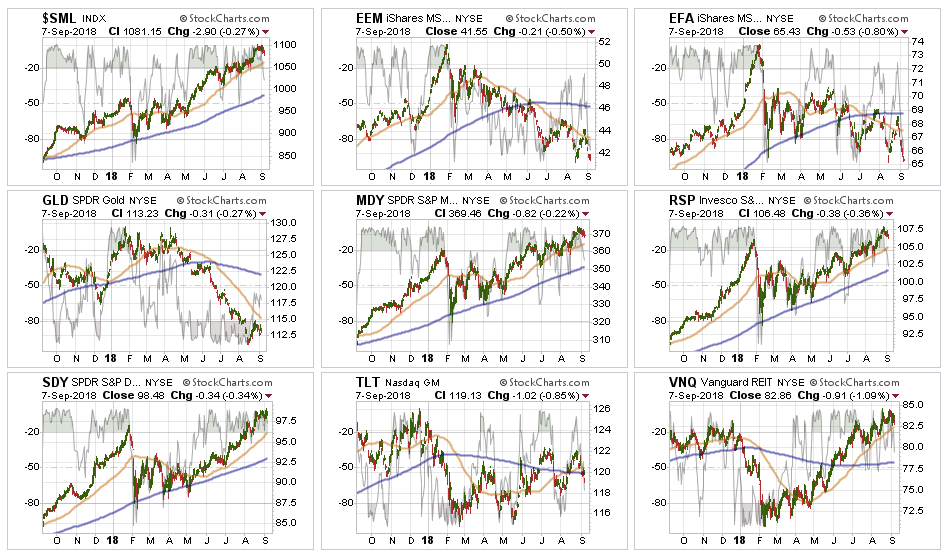
Small-Cap and Mid Cap we noted last week that these markets were extremely overbought and extended, pullbacks to support is needed to add additional exposure. That pullback started last week, but a decent opportunity to add exposure at this time is not available. We continue to hold our target exposure and will look for opportunity as it comes.
Emerging and International Markets as I have repeated for the last few months:
“These sectors were removed in January from portfolios on the basis that “trade wars” and “rising rates” were not good for these groups. With the addition of the ‘Turkey Crisis,’ ongoing tariffs, and trade wars, there is simply no reason to add “drag” to a portfolio currently. These two markets are likely to get much worse before they get better. Put stops on all positions.”
The recent bounce again failed at the declining 50-dma. Positions should have been sold on that failed rally. Stops at the recent lows were triggered on Friday and suggests positions be closed out as lower levels are likely at this time.
Dividends and Equal weight continue to hold their own and we continue to hold our allocations to these “core holdings.” We will overweight these positions on a pullback to support that does not violate that level.
Gold – If you are still hanging onto Gold, we have been consistently providing stop loss levels and sell points since May of this year. These points have continued to decline. Two weeks ago we gave a rally sale point of $114 which was achieved. Stops remain at $111 this week.
Bonds – bonds sold off on Friday with the employment report which showed an increase in nominal wage growth. That small bit of growth will be wiped away next week when CPI is reported and “real wages” are revealed. This is as good of a trading opportunity as there is to add bonds to portfolios. $118 is the stop with a target of $121.50.
REIT’s keep bouncing off the 50-dma like clockwork. Despite rising rates, the sector has continued to catch a share of money flows and the entire backdrop is bullish for REIT’s. However, with the sector very overbought, take profits and rebalance back to weight and look for pullbacks to support to add exposure.
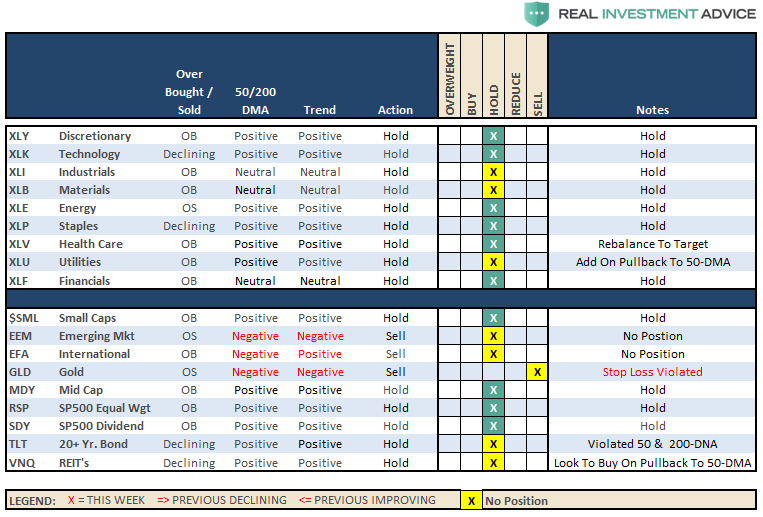
The table below shows thoughts on specific actions related to the current market environment.
(These are not recommendations or solicitations to take any action. This is for informational purposes only related to market extremes and contrarian positioning within portfolios. Use at your own risk and peril.)
Portfolio/Client Update:
Over the last several weeks, I have discussed the increases to equity exposure in portfolios as the market’s momentum has continued to push higher. However, we have done this cautiously by using pullbacks to support, which then subsequently broke out above resistance, to do so.
Last week, the market was able to hold above the “breakout” levels once again, so we will look to take the following actions within the next week or so. The pullback we have been looking for to provide a better entry point has occurred and with the market approaching a short-term oversold condition, this is a decent entry point. We will look for any strength on Monday as an opportunity to add a bit more risk to the mix to be positioned in portfolios for the potential year-end upside bias.
- New clients: Add 50% of target equity allocations.
- Equity Model: Semiconductors (MU & KLAC) are on “Sell Alerts” – we will monitor closely and stop-loss levels have been tightened up. We will add a few new positions as needed.
- Equity/ETF blended – Same as with the equity model.
- ETF Model: We will overweight core “domestic” indices by adding a pure S&P 500 index ETF to offset lack of international exposure. We remain overweight outperforming sectors to offset underweights in under-performing sectors.
- Option-Wrapped Equity Model – Looking to add two new positions to the portfolio.
Again, we are moving cautiously. There is mounting evidence of short to intermediate-term risk of which we are very aware. However, the trend of the market remains positive, and we realize that short-term performance is just as important as long-term. It is always a challenge to marry both.
It is important to understand that when we add to our equity allocations, ALL purchases are initially “trades” that can, and will, be closed out quickly if they fail to work as anticipated. This is why we “step” into positions initially. Once a “trade” begins to work as anticipated, it is then brought to the appropriate portfolio weight and becomes a long-term investment. We will unwind these actions either by reducing, selling, or hedging, if the market environment changes for the worse.


