Written by Lance Roberts, Clarity Financial
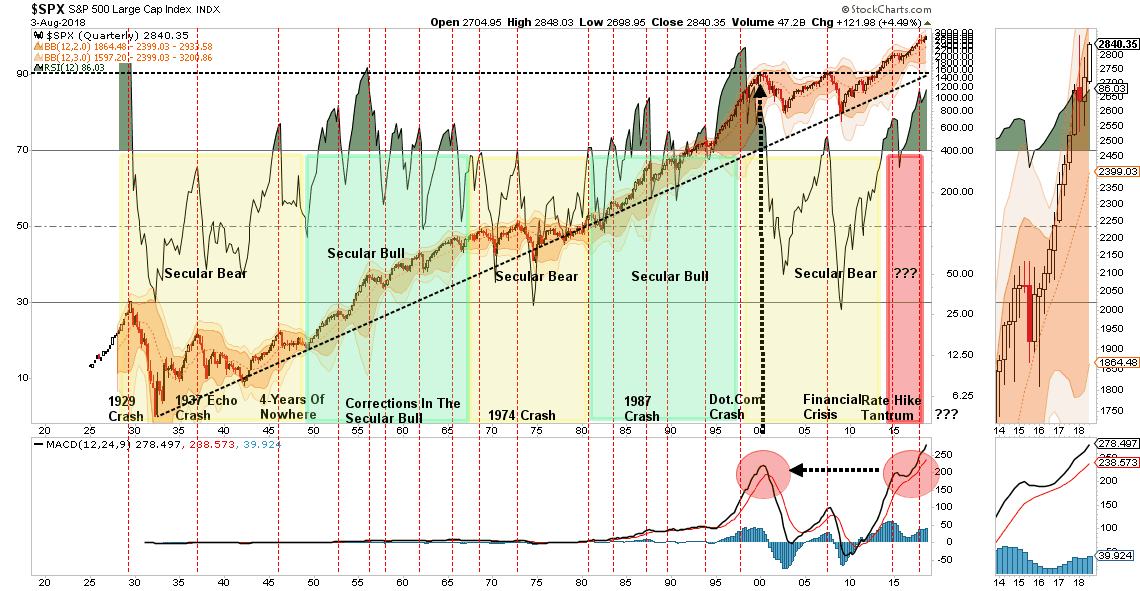
Last week, we discussed how the market managed to clear the “Maginot Line“ which brings January highs into focus. The chart below is the updated analysis from last week.

Please share this article – Go to very top of page, right hand side, for social media buttons.

Given this is a “weekly” chart, it takes much more time for signals to register. The advance over the last few weeks has taken the market back into overbought territory and was a point made last week:
“The market can most assuredly get even more overbought from current levels, but does suggest that upside is becoming more limited from current levels. However, with the weekly ‘buy signal’ triggered this past week, we must give the bulls some room to run.”
Currently, the “bulls” remain clearly in charge of the market…for now. While it seems as if much of the “tariff talk” has been priced into stocks, what likely hasn’t as of yet is rising evidence of weakening economic data (ISM, employment, etc.), weakening consumer demand, and the impact of higher rates.
While on an intermediate-term basis these macro issues will matter, it is primarily just sentiment that matters in the short-term. From that perspective, the market retested the previous breakout above the March highs last week (the Maginot line) which keeps Pathway #1 intact. It also suggests that next week will likely see a test of the January highs.

With moving averages rising, this shifts Pathway #2a and #2b further out into the August and September time frames. The potential for a correction back to support before a second attempt at all-time highs would align with normal seasonal weakness heading into the Fall.
Currently, there is a very low risk of a deeper correction (Pathway #3). However, it is a possibility that should not be ignored at this juncture. With the administration gearing up for further tariffs against China, and China retaliating in kind, at a time when the Fed is already more aggressively tightening monetary policy, it would be remiss to ignore the risk of “something going wrong.”
It would also be remiss to not remind you that despite the “bullish short-term view,” the long-term outlook remains decidedly bearish. With valuations elevated, price extended, and deviations near historic records, the potential for a more severe correction in prices is an absolute certainty.
The issue is that these cycles can remain both fundamentally and technically overvalued for longer than logic would dictate particularly when there are artificial influences at play. However, the message is clear for those that choose to listen. This is why it is crucially important to have a discipline and strategy in place which will manage the exposure to risk when things change in the market.
Weekly Buy Signal Is In, But Don’t Jump
In the 401k Plan Manager (posted tomorrow), I publish the model that drives our portfolio allocations over time.
There are two important concepts to understand about this model.
- Risk knows no age: Risk doesn’t care how old you are. It is often said that if you are 20, you should take on a lot of portfolio risk. However, if that risk is taken at the top of a market cycle, the damage to the long-term financial goals can be disastrous. We believe that our allocation to risk has nothing to do with our age, and everything to do with the potential for the loss of capital. Therefore, our allocation model is broken into two parts.
- Allocation model is based upon current valuation levels.
- If valuations were 10-12x earnings the target allocation levels would be primarily weighted towards equity (i.e. 80% Stocks / 20% Bonds)
- As valuations rise behind historical extremes, target equity levels are reduced. (i.e. 60/40, 50/50, etc.)
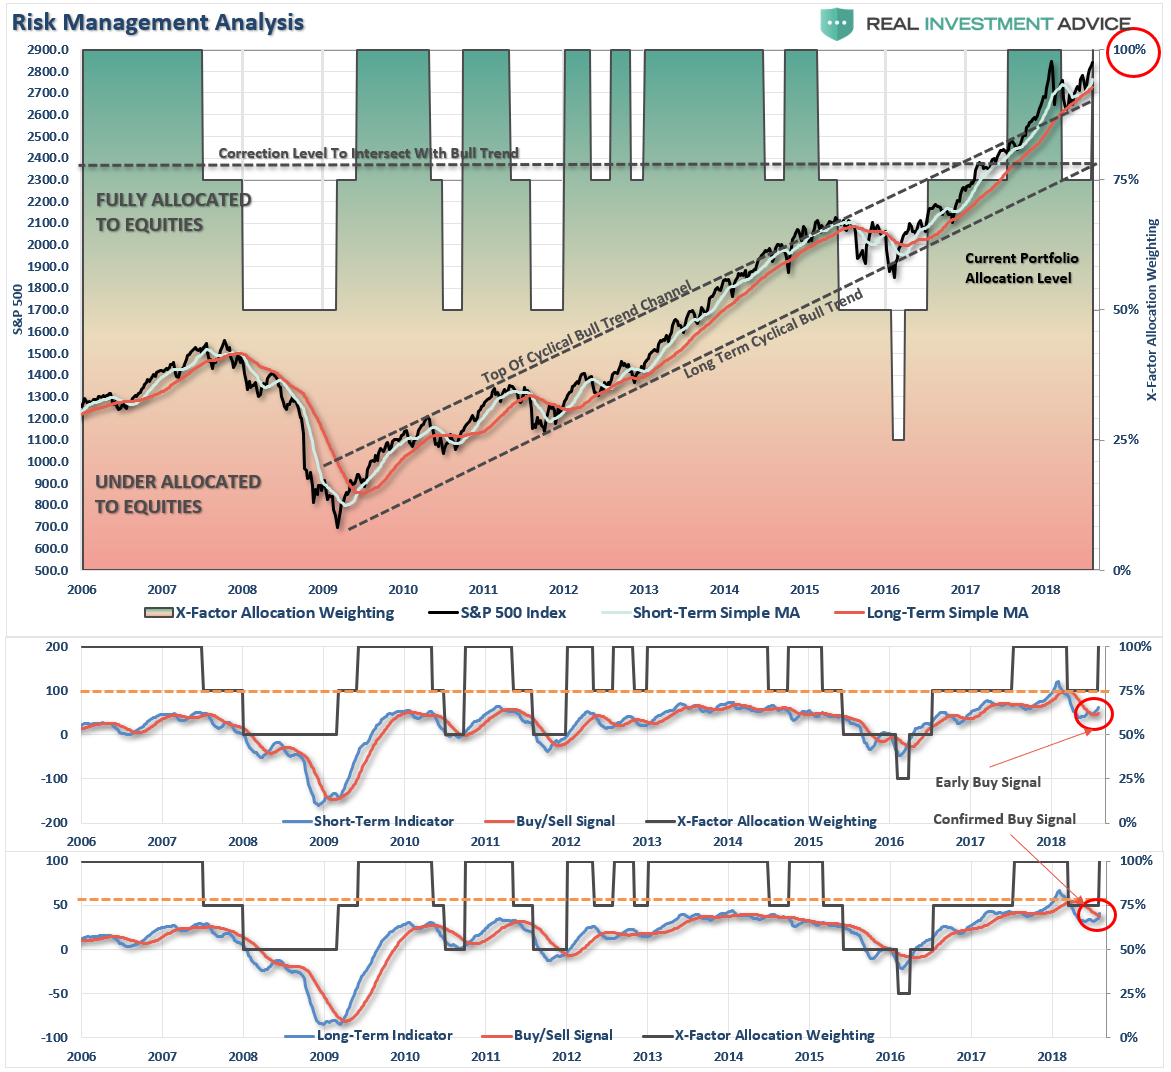
- The EQUITY portion of the allocation is also adjusted based on current market risk. Earlier this year, the equity risk portion of the allocation model was reduced from 100% to 75% due to a triggering of a confirmed “sell” signal. There are 4-primary indicators to the model:
- 1st signal – short-term warning signal. Only an alert to pay attention to portfolio risk.
- 2nd signal – reduce equity by 25%.
- 3rd signal – (Moving average cross-over) reduce equity by another 25%.
- 4th signal – (Trend change) – reduce equity by another 25% and short the market.
- Allocation model is based upon current valuation levels.
We will be posting a live version of our indicators at RIAPro.net (currently in beta) as shown below.

The 4-signals above also run in reverse. So, when a signal reverses itself, equity risk is increased in the model as is the case this week.
With that signal in place, we must now increase our portfolio allocation model to 100% of target.
However, it is important to note these signals are based on “weekly” data and are intermediate-term in nature. Therefore, by the time these longer-term indicators are triggered, the very short-term conditions of the market are generally either very overbought, or oversold.
So, Do I Buy Or Not?
At this juncture, most individuals tend to let their emotions get the better of them and they make critical errors with their portfolios. Emotional buying and selling almost always leads you into doing exactly the opposite of what you should do.
Currently, the market has registered a “buy signal,” which means we need to be following our checklist to ensure we are making sound investment decisions:
- What is the allocation model going to look like between asset classes?
- How will those choices affect the volatility of my portfolio relative to the market?
- What is the inherent risk of being wrong with my choices?
- What is my exit point to sell as the market goes up?
- Where is my exit point to sell if the market goes down?
- What specific investments will I use to fill each piece of my allocation model?
- How does each of those investments affect the portfolio as a whole as well as each other?
- Where is my greatest and least amount of exposure in my portfolio?
- Have I properly hedged my risk in my portfolio in case of a catastrophic event?
If you can’t answer the majority of these questions – you should not be putting your money in the market.
These are the questions that we ask ourselves every day with our portfolio allocation structures and you should be doing the same. This is basic portfolio management. Investing without understanding the risk and implications is like driving with your eyes closed. You may be fine for a while but you are going to get seriously hurt somewhere along the way.
There is NO RULE which states you have to jump into the market with both feet today. This is not a competition or game that you are trying to beat. Who cares if your neighbor made 1% more than you last year. Comparison is the one thing that will lead you to take far more risk in your portfolio than you realize. While you will love the portfolio as it rises with the market; you will rue the day when the market declines.
Being a “contrarian” investor, and going against the grain of the mainstream media, feels like an abomination of nature. However, being a successful investor requires a strict diet of discipline and patience combined with proper planning and execution. Emotions have no place within your investment program and need to be checked at the door.
Unfortunately, being emotionless about your money is a very difficult thing for most investors to accomplish. As humans, we tend to extrapolate the success or failure within our portfolios as success and failure of ourselves as individuals. This is patently wrong. As investors, we will lose more often than we would like – the difference is limiting the losses and maximizing the winnings. This explains why there are so few really successful investors in the world.
With this in mind, it doesn’t mean that you can’t do well as an investor. It just means that you must pay attention to the “risks” inherent in the market and act accordingly.
• Yes, the market is on a “buy” signal.
• Yes, we need to add exposure as shown in the 401k plan manager below.
• No, it doesn’t mean that you need to act immediately
However, it does mean that we need to pay close attention to developments over the next couple of weeks to be sure the “intersection” is clear and that we can proceed to the next traffic light safely. Hopefully, we can catch it “green” – if not, we will obey the signal, stop, and wait for our turn once again.
While the model is being increased back to 100% of target, we will selectively add equity exposure during short-term corrective actions in the market.
As I noted last week:
“With our portfolios nearly fully allocated, there are not a lot of actions we need to take currently as the markets continue to trend higher for now. We will continue to monitor our exposure and hedge risk accordingly, but with the weekly “buy signal” registered, we are keeping our hedges limited and are widening our stops just a bit.
As noted above, a short-term correction is needed before adding further equity exposure to portfolios. That correction likely started on Friday, and I will not be surprised to see it continue into next week. A retest of 2800 is likely at this point, which would keep Pathway #1 intact. However, a violation of that level will likely trigger a short-term sell signal, which could push the market back towards previous support at 2740.
There is a lot of support forming at 2740, which should be supportive of the market over the next couple of months. A violation of that level suggests something has likely broken and more protective actions should be taken.”
Until that happens, we will give the markets the benefit of the doubt…for now.


