Written by Rick Ackerman, Rick’s Picks
A Novel Idea for the Devout Permabear
There should little that is unfamiliar in today’s chart, which we’ve considered dozens of times since stocks broke sharply lower in February. Punctuated by occasional, wild price swings, stocks have been grinding along ever since, meting out growing dollops of frustration to any trader, investor or forecaster who would seek to benefit from the ongoing drama (or, mostly, lack thereof).

Please share this article – Go to very top of page, right hand side, for social media buttons.
Today, however, I want to share one simple observation that is as straightforward and free from emotional bias as I can make it. To wit, the S&P 500 (using the E-Mini S&Ps as a vehicle) became a ‘mechanical’ buy when it fell to the green line on March 22. That is bullish, plain and simple.
The ‘mechanical’ trade implied is a specialty of Rick’s Picks because it has worked so consistently for subscribers. Without going into the proprietary details of why the ‘mechanical’ buy shown is such a beautiful specimen, I’ll say only that it leaves little room for doubting bulls, let alone for permabearish skeptics like myself. A key feature of such set-ups is that they excel at handling the scary, second-wave dive that so frequently interrupts otherwise very-bullish-looking charts. In this case, the all-but-obligatory dive took the E-Minis down by nearly 10% in March, narrowly missing a theoretical stop-loss that would have triggered just beneath 2532.50, the pattern’s point ‘C’ low.
‘Mechanical’ Indicator Unintimidated
A very similar pattern has replicated itself many times in other stocks – all instances where presumably even the most steadfast bulls would have thought twice about sticking around. The most persuasive instances of recent note came in CRISPR Therapeutics, as well as in some of the more popular bitcoin trading vehicles before they went brain-dead.
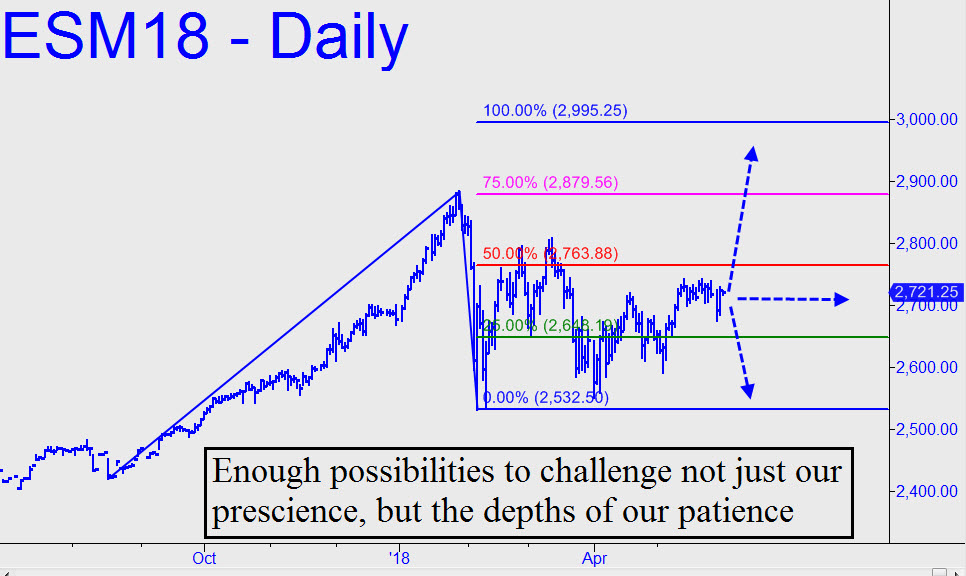
Bottom line: The E-mini S&Ps are not only on a long-term buy signal, they look likely to achieve the 2995.25 target. This seems incredible to me for economic reasons I have explained in detail several times. I expect the U.S. to be in recession before the year ends. But to be as objective about it as I can, I must concede that the chart shown seems to know nothing of this, nor to care.
If you don’t subscribe but want to join in the fun, click here for a two-week free trial to Rick’s Picks, including access to a 24/7 chat room that draws great traders from around the world.


