Written by Lance Roberts, Clarity Financial
Last Tuesday, we updated our commentary on the “jailbreak” which occurred last week with the move above resistance and the previous closing high downtrend.

Please share this article – Go to very top of page, right hand side, for social media buttons.
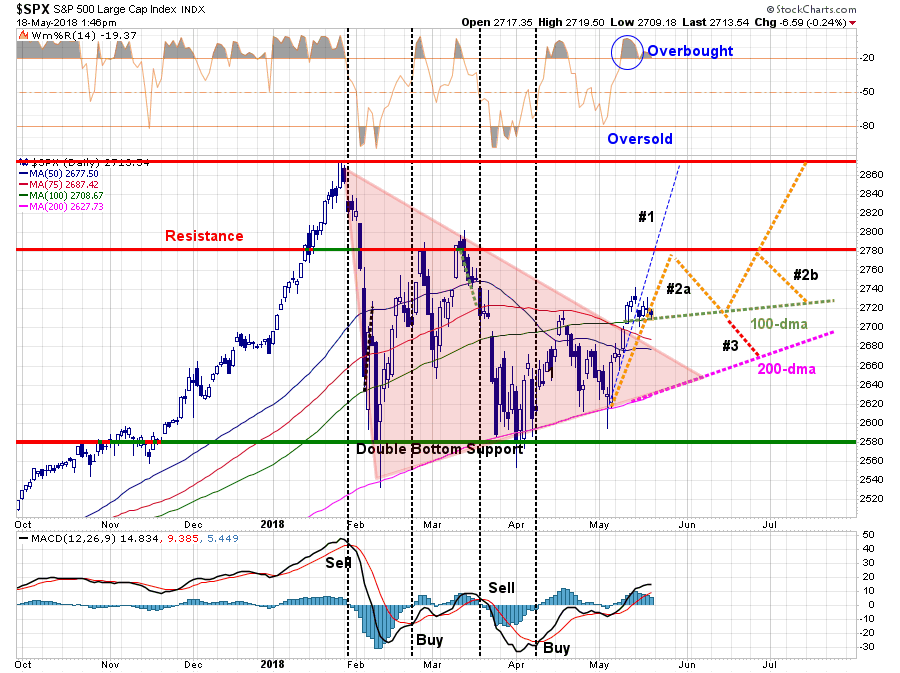
“With the market back to very short-term ‘overbought’ territory, a bit of a pause is likely in order. We currently suspect, with complacency and bullish optimism quickly returning, a further short-term advance towards 2780 is likely.
- Pathway #1 suggests a break above the next resistance level will quickly put January highs back in view. (20% probability)
- Pathway #2a shows a rally to resistance, with a pullback to support at the 100-dma, which allows the market to work off some of the short-term overbought condition before making a push higher. (30% probability)
- Pathway #2b suggests the market continues a consolidation process into the summer building a more protracted “pennant” formation. (30% probability)
- Pathway #3 fails support at the 100-dma and retests the 200-dma. (20% probability)”
Chart updated through Friday:
“Again, these are just ‘guesses’ out of a multitude of potential variations in the future. The reality is that no one knows for sure where the market is heading next. These ‘pathways’ are simply an ‘educated guess’ upon which we can begin to make some portfolio management decisions related to allocations, risk controls, cash levels and positioning.
But while the short-term backdrop is bullish, there is also a rising probability this could be a ‘trap.’”
Over the past week, the market did consolidate its recent breakout by pausing just above the previous resistance level of the 100-day moving average.
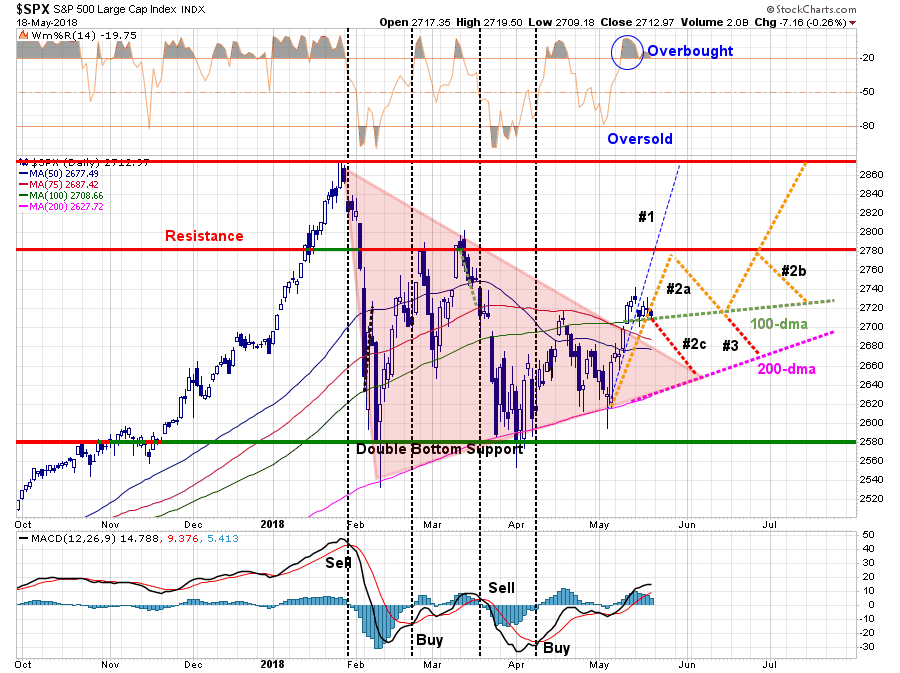
As shown, in the first chart above, this “pause” sets the market up for a continuation of pathway #2a to the next level of resistance. However, there is a reasonable possibility that has opened up of a new path (#2c) which could lead to another retest of the 200-dma if the market breaks the current support.
Pathway #2c is currently a binary outcome and will only exist next week. Either the market will move higher next week and continue following pathway #2b or it won’t. Monday will likely “tell the tale” and I will update this analysis in Tuesday’s report.
Where does that leave us now in terms of our portfolio models?
I noted last week that we added some of the cash we had raised on rallies over the last couple of months back onto the equity side of our portfolios. However, we still maintain an overweight position on cash currently as a hedge against potential market risk. (In this case pathway #2c)
If the market is able to move above last week’s highs, we will add further exposure to equity risk side of the portfolio. But, we will do so with very tight stop-loss levels and with added hedges as necessary. A failure of support will keep our cash levels elevated and we will wait to see where the market finds its next support before taking further actions.
Our concern over the broader market remains, and I have expanded that list further this week:
- The Fed is raising interest rates and reducing their balance sheet.
- The yield curve continues to flatten and risks inverting.
- Despite strong earnings this past quarter, valuations remain very elevated.
- The lack of liquidity in both the bond and equity markets are of great concern.
- Market leverage remains at historically high levels. (Which isn’t a problem until it is.)
- Credit growth continues to slow suggesting weaker consumption and leads recessions
- The ECB has started tapering its QE program.
- Global growth is showing signs of stalling.
- Domestic growth has weakened.
- While EPS growth has been strong, year-over-year comparisons will become challenging.
- Rising energy prices are a tax on consumption
- Rising interest rates are beginning to challenge the valuation story.
We remain invested, but are also highly aware we are closer to the end of the “bullish-half” of the market cycle than not.
Why? Valuations, silly.
“Only 9% of the time in history have U.S. stocks been so expensive.” – David Rosenberg, Gluskin-Sheff
Rosenberg recently showed a table of gross domestic product (GDP) growth figures during the last nine bull rallies. The table reveals a dire trend where each subsequent bull rally in the last 70 years generated less GDP growth. The important message is that investors have consistently been paying more, for less growth.
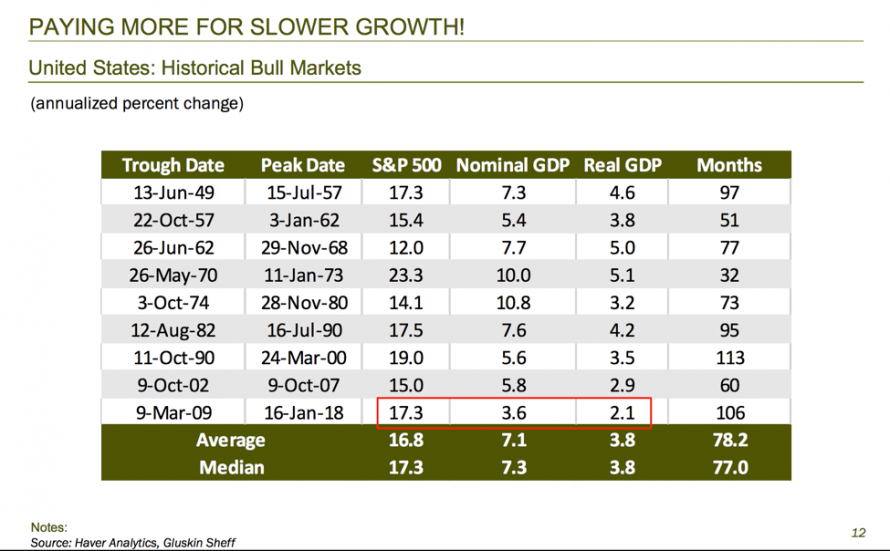
The market is currently overpriced and overvalued by about a third. While investors can certainly bid up prices in the short-term, the long-term fundamentals will eventually come to play.
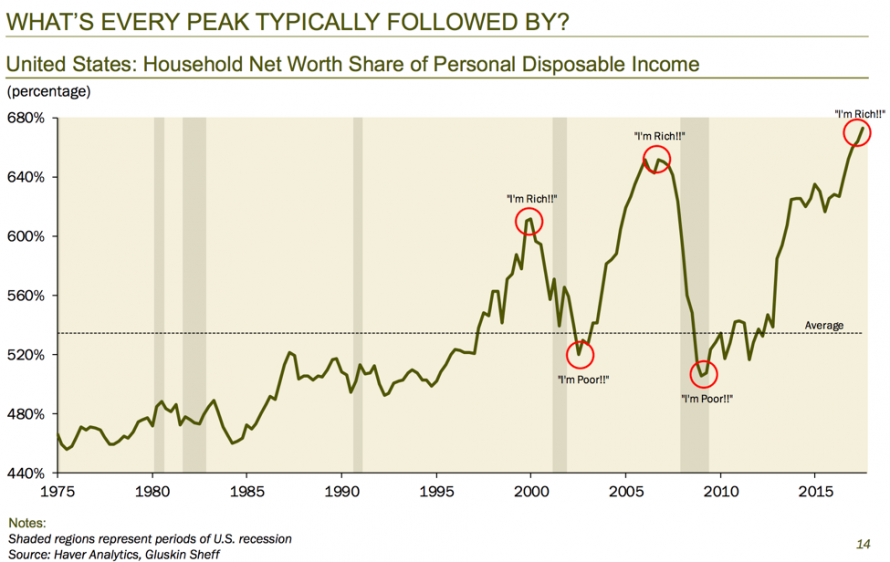
With households more exposed to financial assets currently than at any other point in history, the next downturn will be greatly exacerbated by the “panic” that ensues. As you can see in the chart below, the last two peaks in this ratio almost perfectly coincided with the dot-com crash and the 2008 financial crisis.
David’s most salient point came from a quote from Federal Reserve Bank of San Francisco. He pointed out that, having access to tons of research, they themselves admit that equity valuations are so stretched that there will be no returns in the next decade:
“Current valuation ratios for households and businesses are high relative to historical benchmarks … we find that the current price-to-earnings ratio predicts approximately zero growth in real equity prices over the next 10 years.”
Basically, the Fed is giving investors an explicit warning that the market will “mean revert.”
But revert, doesn’t mean stop at the mean.
According to David’s calculations, if the household net worth/GDP ratio reverted to the mean, savings rates would go from 2% to 6%. As a result, GDP would go down 3%, which would have nasty consequences for the economy and, in turn, stocks.
Just something to think about.


