Written by Jeff Miller, A Dash of Insight
— this post authored by Mark D. Hines
Our previous article asked the question: Are You Out Of Your Comfort Zone? We reviewed how traders must adapt to changing market conditions rather than sticking to old trading methods that were once profitable, but are now destructive. If you missed it, a glance at your news feed will show that the key points remain relevant.
This Week: Do You Trade the 50-Day Moving Average?

Please share this article – Go to very top of page, right hand side, for social media buttons.
Editor’s note: This article was written over one month ago. A mpore appropriate question today might be; Do you trade the 200-day moving average?
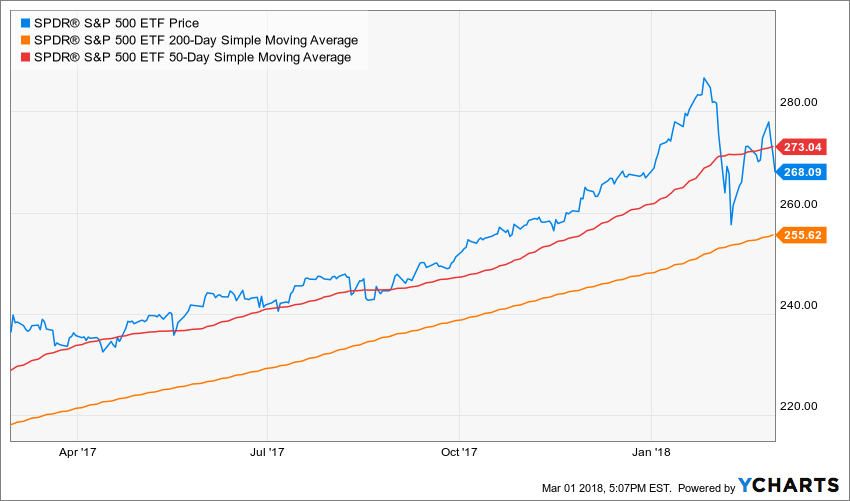
The following chart shows the S&P 500 basically skipped along the top of its 50-day moving average for most of the last year.
And the same is largely true for the NASDAQ.

This basic technical trading indicator (50-day moving average) is used by so many market participants that it often serves as a magnet, and then support or resistance. However, when something sends the market through this level, many stops are often triggered, thereby increasing the market move. For example, here is a look at the S&P 500 over the last week.
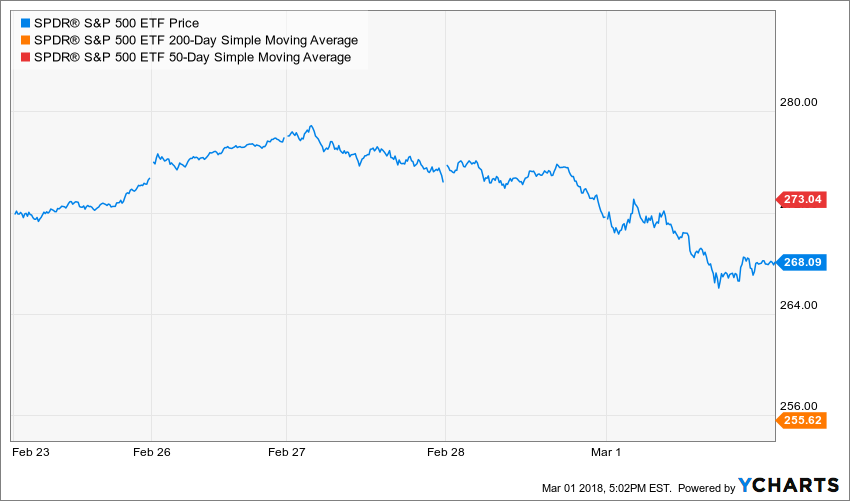
The market was down moderately on Wednesday of this week (Feb 28th), but then collapsed around the 50-day moving average. Regarding such market moves, our models do not anticipate down moves, but do exit in time to avoid the big losses. According to an article from Morningstar earlier this week (Will Active Stock Funds Save Your Bacon in a Downturn?), active management has most of its advantages in down markets.
Another advantage of our models is when our performance is staying even with the markets, our returns still have a significantly low correlation, which is powerful for risk management purposes (it helps keep volatility lower).
Model Performance:
Per reader feedback, we’re continuing to share the performance of our trading models. This week we have extended the performance reporting back further, to 12-months.
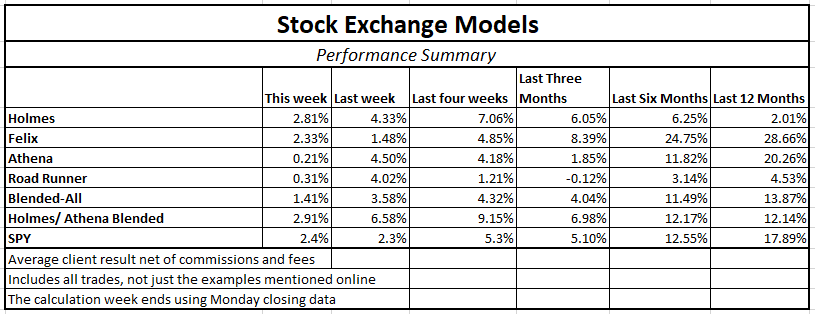
Important to note, we find that blending a trend-following / momentum model (Athena) with a mean reversion / dip-buying model (Holmes) provides two strategies, effective in their own right, that are not correlated with each other or with the overall market. By combining the two, we can get more diversity, lower risk, and a smoother string of returns.
And for these reasons, I am changing the “Trade with Jeff” offer at Seeking Alpha to include a 50-50 split between Holmes and Athena. Current participants have already agreed to this. Since our costs on Athena are lower, we have also lowered the fees for the combination.
If you have been thinking about giving it a try, click through at the bottom of this post for more information. Also, readers are invited to write to main at newarc dot com for our free, brief description of how we created the Stock Exchange models.
Expert Picks From The Models:
This week’s Stock Exchange is being edited by Blue Harbinger; (Blue Harbinger is a source for independent investment ideas).
Holmes: This week I like Wayfair (W). I purchased shares on 2/23 when the price was down. Are you familiar with this stock?

Blue Harbinger: Yes, Holmes – I am familiar. Wayfair basically sells all kinds of stuff online, both domestically and internationally, through a variety of websites. The company is not profitable, but sales and the stock price have both been growing rapidly, especially over the last year. For your reference, here is a look at the Fast Graph.
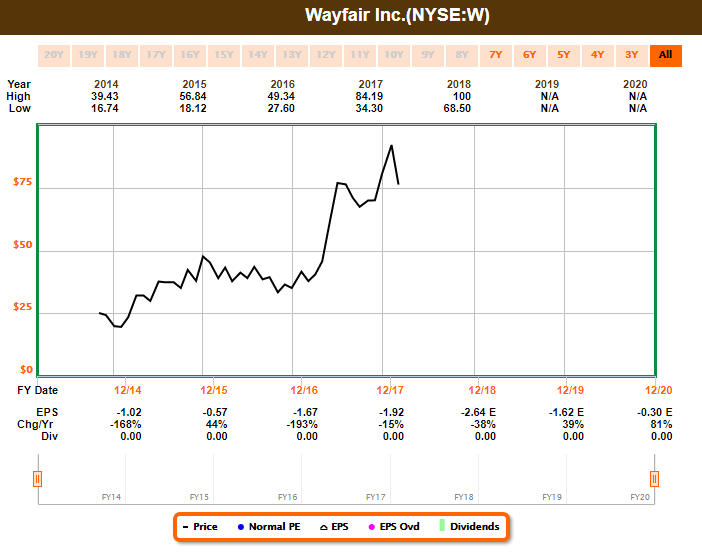
Holmes: That is interesting information, but I like the shares because I am a “dip-buyer,” and Wayfair’s dip over the last week is the sort of set up I like to see. From the chart below, you can see it is below its 50-day moving average, and it has attractive upside over the next six weeks.
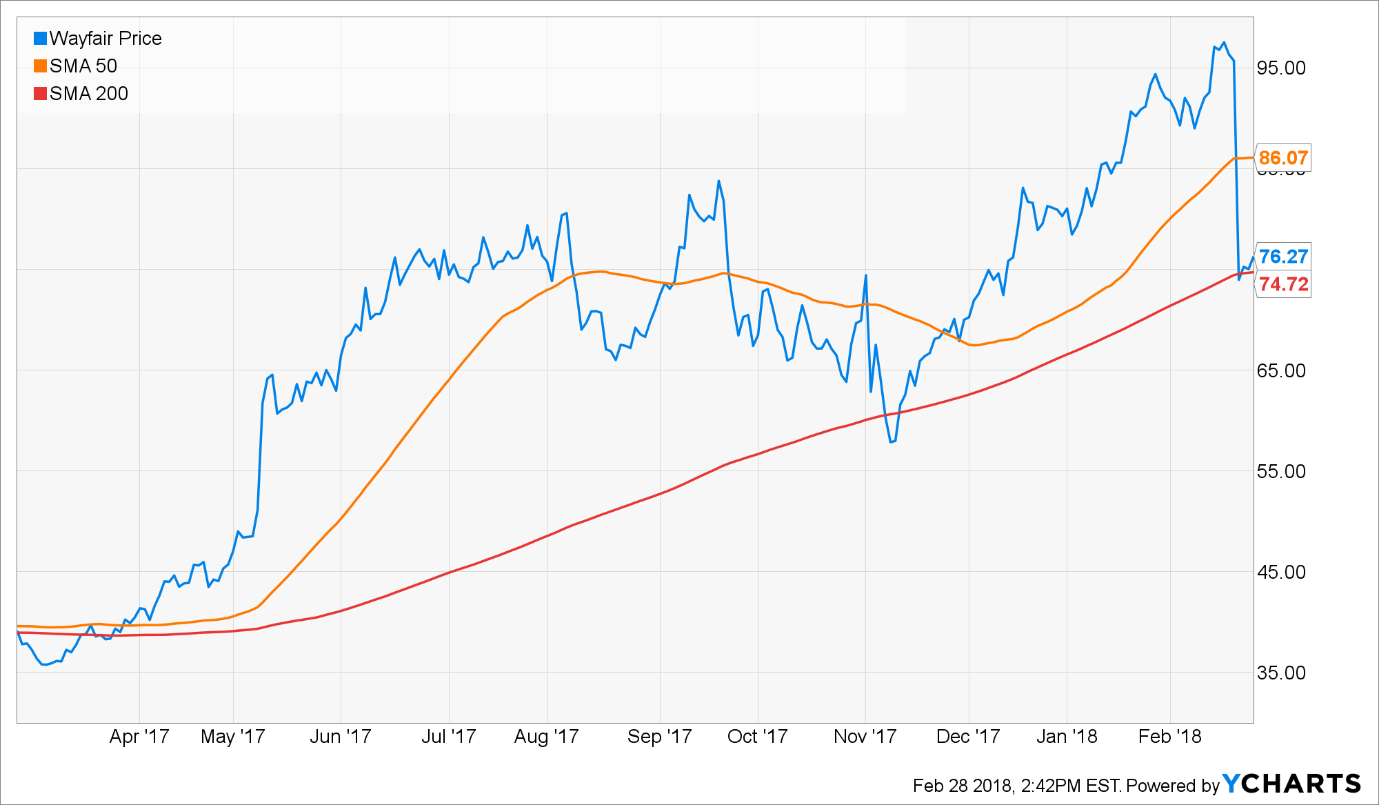
BH: That dip is because the market didn’t especially like the company’s latest earnings announcement. The share price seems to be bouncing off the 200-day moving average though. What do you have to say about that Holmes.
Holmes: I am aware of the 200-day and 50-day moving averages. I typically hold my position for about 6-weeks, so why don’t you check back in with me on this one then.
BH: Sure. How about you, Road Runner – what have you got for us this week?
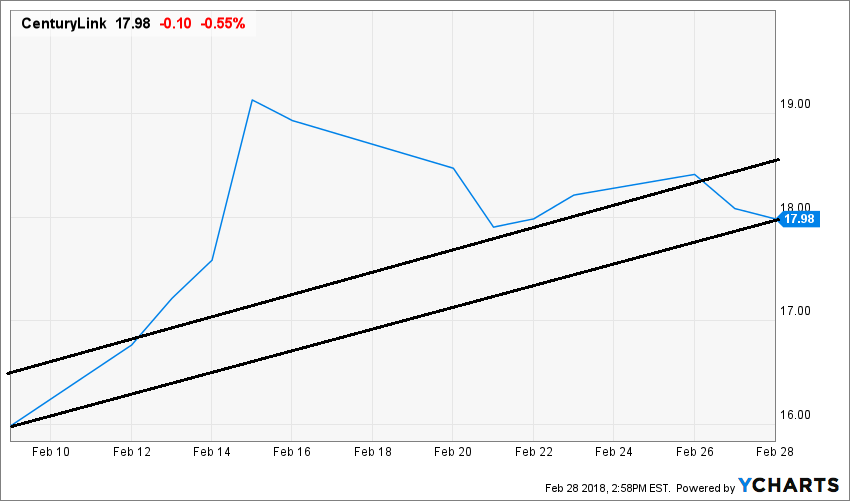
Road Runner: I bought CenturyLink (CTL) on 2/28. How do you like that one?
BH: Yikes. Really? You bought a stock with a 12.4% dividend yield. Isn’t that a bit of a red flag for you, Holmes? I’m worried you’re doing what I often refer to as “yield chasing.”
RR: I’m not investing in this stock for the dividend, I typically hold for only about four weeks. And you know this, BH – we discuss it almost every week. I like to buy stocks at the low end of a rising channel, as shown for CTL in the following chart.
BH: Well, the telecom business is capital intensive, which could create challenges in our current rising interest rate environment. Plus its share price is down 50% in the last 5 years. Here is a look at the Fast Graph
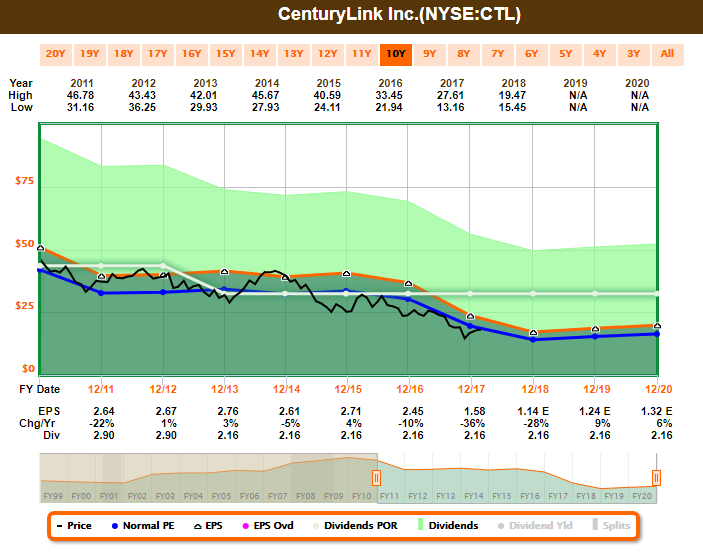
RR: Again, 4-weeks is my typical holding period. I like the setup on this one. Check back with me then.
BH: Fine. How about you Felix – what have you got for us?
Felix: I sold my Valeant (VRX) shares on 2/26. I purchased them back on 5/8/17.
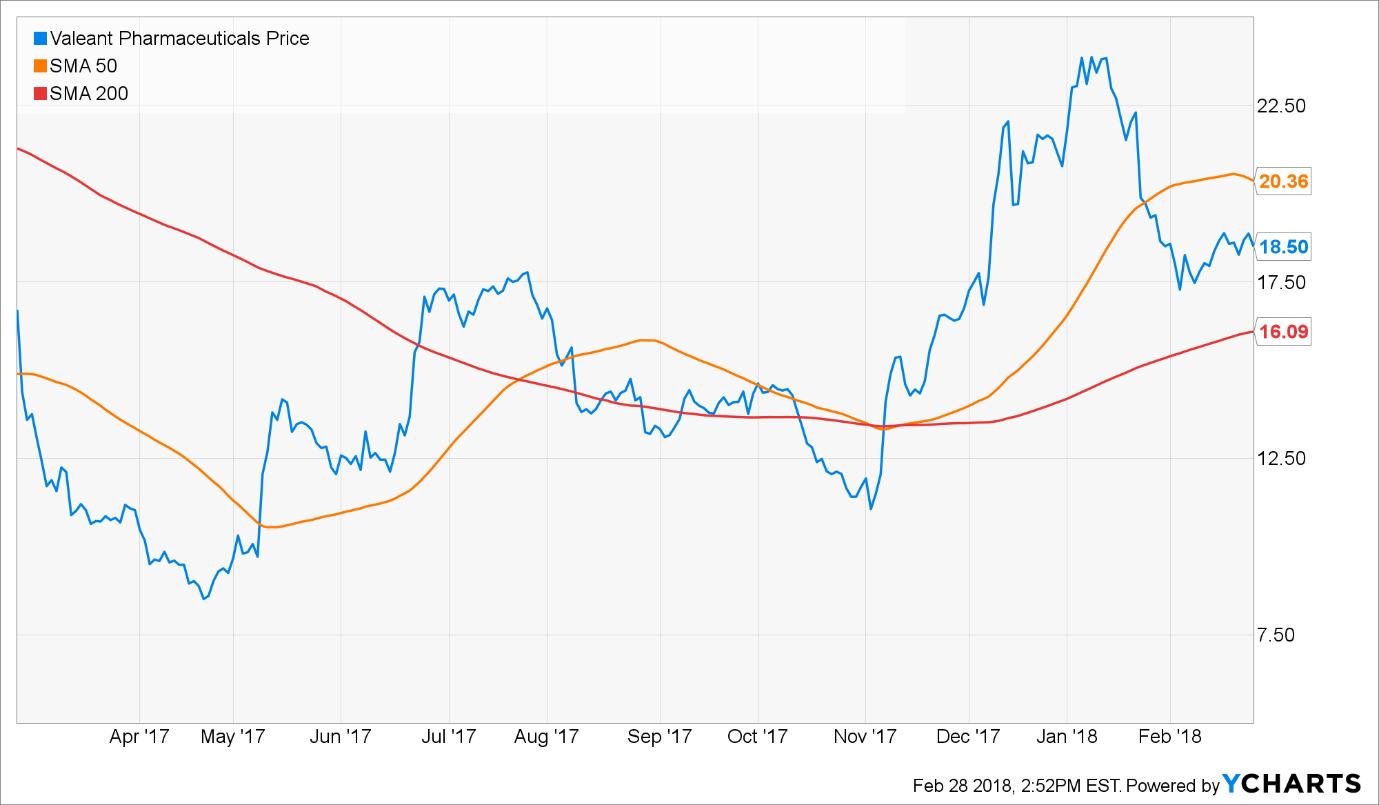
BH: Looks like it was a bumpy ride, but you made money. And based on the performance table earlier in this report, it looks like you’ve been making a lot of money over the last year, Felix.
Felix: Thanks for noticing. My momentum strategy has been in style. Check out the performance of momentum stocks versus other styles over the last year, in this table as of February month-end.
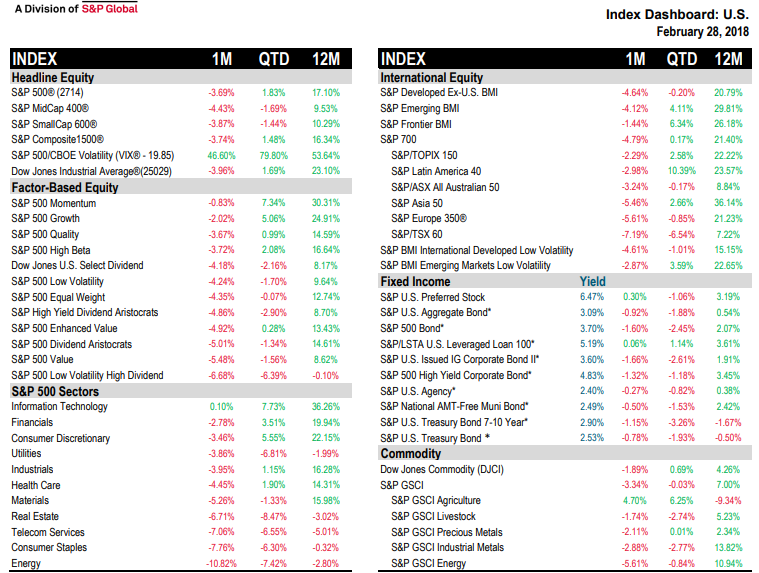
BH: Interesting data, Felix, thanks for sharing.
Felix: I also ran the Russell 2000 small cap index stocks through my model this week, and I’m sharing my top 20 in the following ranking.
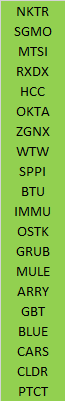
BH: I see Mulesoft (MULE) on your list. It’s a small cap cloud Software as a Service company with tremendous growth and a lot of room to run. I’ve been keeping an eye on that one. Anyway, how about you Oscar – what have you got for us this week?
Oscar: This week I ran the diverse and comprehensive ETF universe through my model, and I’m sharing my top 20 rankings in the following table.
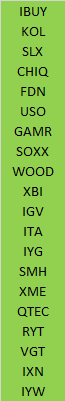
BH: I see U.S. Oil (USO) on your list. But I thought you were a momentum trader, Oscar. Isn’t oil down? I know the energy sector is way down based on the table Felix shared earlier.
Oscar: Yes I am a momentum trader (I typically hold for about 6-weeks) and yes oil is down, but it has started to rebound already after its big decline in early February.
BH: Interesting that oil is rebounding but the energy sector is not. But I suppose part of that is news from the new Fed chair that this latest batch of market volatility won’t stop the Fed from raising interest rates. A lot of energy companies rely heaviliy on debt to fund growth, and higher rates means more expensive growth.
Conclusion:
The simple 50-day moving average is a popular guidepost and risk indicator for many technical traders. As long as the market stays close, things have been calm, but when it breaks through, stop orders kick in, and market conditions can become increasingly volatile. Our active models don’t anticipate down moves, but they do avoid the biggest losses. Another advantage of our models are their blended approach, which helps generate strong returns with a lower market correlation – something very valuable for volatility reduction purposes.
Background On The Stock Exchange:
Each week, Felix and Oscar host a poker game for some of their friends. Since they are all traders, they love to discuss their best current ideas before the game starts. They like to call this their “Stock Exchange.” (Check out Background on the Stock Exchange for more background). Their methods are excellent, as you know if you have been following the series. Since the time frames and risk profiles differ, so do the stock ideas. You get to be a fly on the wall from my report. I am usually the only human present and the only one using any fundamental analysis.
The result? Several expert ideas each week from traders, and a brief comment on the fundamentals from the human investor. The models are named to make it easy to remember their trading personalities.

Getting Updates:
Readers are welcome to suggest individual stocks and/or ETFs to be added to our model lists. We keep a running list of all securities our readers recommend, and we share the results within this weekly “Stock Exchange” series when feasible. Send your ideas to “etf at newarc dot com.” Also, we will share additional information about the models, including test data, with those interested in investing. Suggestions and comments about this weekly “Stock Exchange” report are welcome.
Trade Alongside Jeff Miller: Learn More.


