by Michael Clark
Written 31 March 2018
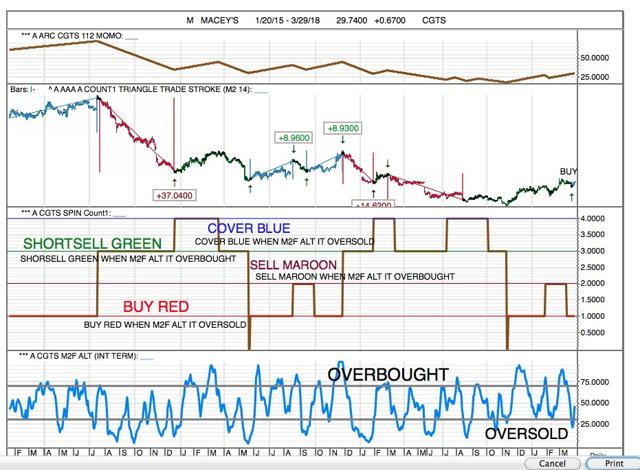
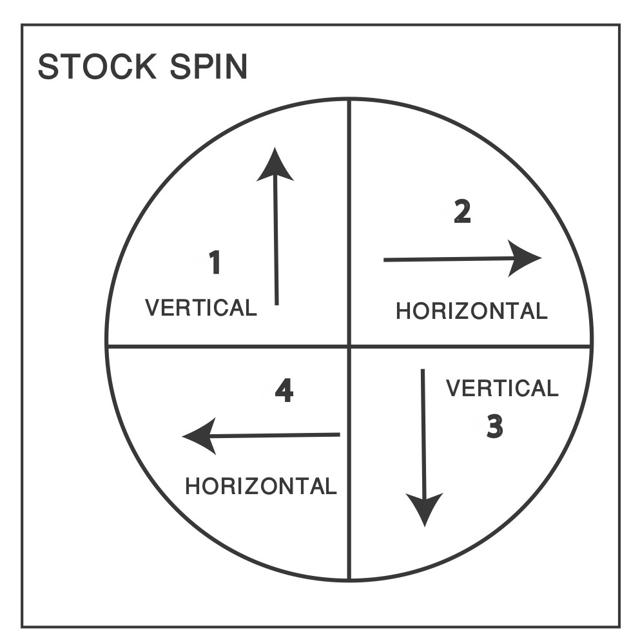
It is typical of me to energize myself during stock market corrections through the creation of new trading systems, bigger and better than earlier systems. Our most recent obsession (during the recent correction) included this new system: COUNT1 SPIN, M2F ALT IT. We buy when COUNT1 SPIN =1 (bullish) and M2F ALT IT is OVERSOLD (or less than 30). We sell when COUNT1 SPIN = 2 (TRADING SELL) and when M2F ALT IT is OVERBOUGHT (greater than 70).
Please share this article – Go to very top of page, right hand side, for social media buttons.
We tested the Dow Jones Industrial Average because we have data reaching back to the 1920’s. However, our current program will only run the test back to 1960. Anyway, here is our result testing DJIA back to 1960:
The number of TRADING DAYS are listed in the second column, ie, the first trade lasted 18 days only. The next trade lasted 259 TRADING DAYS, or almost exactly one year. The longest-lasting trade lasted 1.898 TRADING DAYS, from 1/91 through 8/98.
1 Long 18 01/04/60 01/28/60 +171.19 +37.32 Exit Long Rule
2 Long 259 01/05/61 01/17/62 +74.74 +12.00 Exit Long Rule
3 Long 818 11/12/62 02/10/66 +366.40 +58.68 Exit Long Rule
4 Short 219 03/01/66 01/12/67 +108.24 +11.54 Exit Short Rule
5 Short 115 10/31/67 04/19/68 -17.91 -2.04 Exit Short Rule
6 Short 319 02/20/69 05/29/70 +216.21 +23.59 Exit Short Rule
7 Long 208 08/24/70 06/21/71 +116.95 +15.40 Exit Long Rule
8 Long 256 01/06/72 01/12/73 +130.87 +14.41 Exit Long Rule
9 Short 158 02/26/73 10/10/73 -6.78 -0.71 Exit Short Rule
10 Short 270 11/15/73 12/11/74 +279.20 +31.92 Exit Short Rule
11 Long 428 01/27/75 10/05/76 +274.10 +39.57 Exit Long Rule
12 Long 131 04/17/78 10/20/78 +27.89 +3.44 Exit Long Rule
13 Long 246 03/19/79 03/07/80 -37.03 -4.32 Exit Long Rule
14 Long 248 07/08/80 07/01/81 +70.31 +7.84 Exit Long Rule
15 Long 363 08/20/82 01/26/84 +360.40 +41.46 Exit Long Rule
16 Long 774 08/02/84 08/26/87 +1,535.77 +131.70 Exit Long Rule
17 Short 5 10/15/87 10/22/87 +404.66 +17.18 Exit Short Rule
18 Long 614 03/02/88 08/06/90 +645.05 +31.14 Exit Long Rule
19 Long 1898 01/30/91 08/04/98 +5,774.19 +212.82 Exit Long Rule
20 Long 289 11/23/98 01/18/00 +2,186.45 +23.32 Exit Long Rule
21 Short 123 02/11/00 08/08/00 -551.68 -5.29 Exit Short Rule
22 Short 149 10/11/00 05/16/01 -802.13 -7.70 Exit Short Rule
23 Short 278 08/30/01 10/14/02 +2,042.18 +20.59 Exit Short Rule
24 Long 42 11/22/02 01/27/03 -815.28 -9.26 Exit Long Rule
25 Long 1112 05/12/03 10/10/07 +5,351.96 +61.33 Exit Long Rule
26 Short 335 11/09/07 03/12/09 +5,872.68 +45.03 Exit Short Rule
27 Long 201 08/03/09 05/20/10 +781.45 +8.41 Exit Long Rule
28 Long 183 09/20/10 06/10/11 +1,198.29 +11.14 Exit Long Rule
29 Long 664 08/06/12 06/09/15 +4,646.53 +35.42 Exit Long Rule
30 Long 417 07/14/16 03/29/18 +5,596.77 +30.24 Open
Notice that a LONG TRADE is still in place, which began 7/14/16. According to this system, the recent correction was nothing really (SO FAR) – not a BEAR MARKET surely. This trading system does mark historical BEAR MARKETS and PANICS (1987):
1966-1970
4 Short 219 03/01/66 01/12/67 +108.24 +11.54 Exit Short Rule
5 Short 115 10/31/67 04/19/68 -17.91 -2.04 Exit Short Rule
6 Short 319 02/20/69 05/29/70 +216.21 +23.59 Exit Short Rule
1973-1974
9 Short 158 02/26/73 10/10/73 -6.78 -0.71 Exit Short Rule
10 Short 270 11/15/73 12/11/74 +279.20 +31.92 Exit Short Rule
1987
17 Short 5 10/15/87 10/22/87 +404.66 +17.18 Exit Short Rule
2000 – 2002
21 Short 123 02/11/00 08/08/00 -551.68 -5.29 Exit Short Rule
22 Short 149 10/11/00 05/16/01 -802.13 -7.70 Exit Short Rule
23 Short 278 08/30/01 10/14/02 +2,042.18 +20.59 Exit Short Rule
2007 – 2009
26 Short 335 11/09/07 03/12/09 +5,872.68 +45.03 Exit Short Rule
Again, according to this trading system, we are still in a BULL MARKET move.
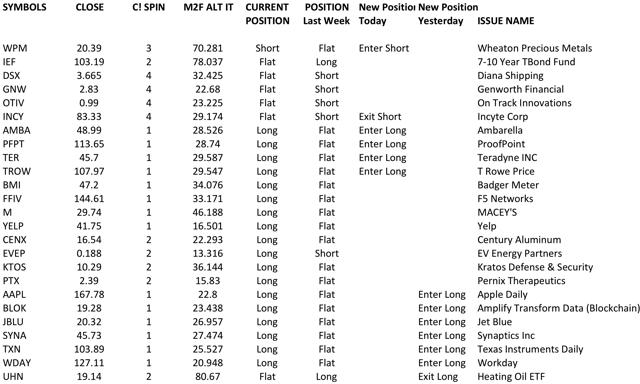
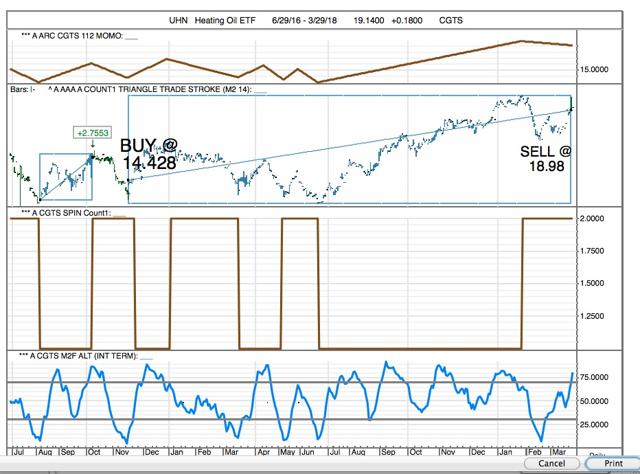
We ran a list of all stocks giving new TRADING SIGNALS for this system this week, and received this result. NOTE: the report shows CURRENT POSITION first, and POSIITON LAST WEEK next. Any issue showing LONG – FLAT changed to a BUY POSITION some time during the week. We next show changes in positions that occurred THURSDAY (for MONDAY) and positions that occurred WEDNESDAY for THURSDAY – the two most recent trading days. If the BULL MARKET was over we would expect to see an abundance of “ENTER SHORT” positions and a paucity of “ENTER LONG” positions. This is not what we see. One SHORT TRADE, WPM, Wheaton Precious Metals. Several SHORT POSITIONS closed: INCY, OIV, GNW, DSX. Two LONG trades closed: IEF (7-10 Year TBONDS and UNH, Heating Oil ETF). The rest are all new LONG positions.
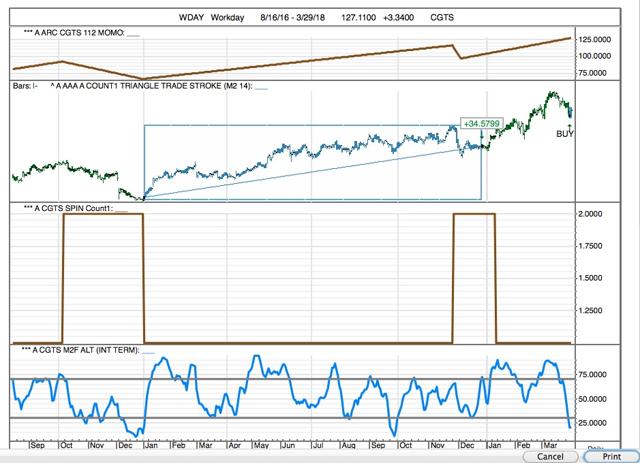
I am long TER, M, EVEP, and TXN from this list. We may buy PFPT, TROW, WDAY in the next few days.
Here are some pictures:
Here are some BUY SIGNALS:
Not much data for BLOK, but still A BUY SIGNAL.
All CGTS subscribers get a list each day for all the 1,000 stocks, ETFs and Indices in our database showing current readings of COUNT1 SPIN and M2F ALT IT. NOTE ALSO: For long-term positions, see COUNT1 SPIN. Any issue with a C1 SPIN 1 or 2 reading is BULLISH. Any issue with a C1 SPIN 3 or 4 reading is BEARISH.
FOR EXAMPLE:
Subscriptions are available through Seeking Alpha’s PRO services.
https://seekingalpha.com/
MJC
For fundamental CGTS descriptions:
http://home.mindspring.com/~mclark7/CGTS142.htm
MJC, CGTS
We have refined our system to a simple system of SPINS.


