from Jeff Miller, A Dash of Insight
— this post authored by Mark D. Hines
Our previous Stock Exchange asked if the current momentum trend is really your friend, and then pointed out the benefits of blending multiple trading approaches. If you missed it, a glance at your news feed will show that the key points remain relevant.
Please share this article – Go to very top of page, right hand side, for social media buttons.
This Week: Do You Know When To Fold Your Trades?
One of the worst mistakes you can make as a trader is to be stubborn. For example, a common mistake among new traders is refusing to cut your losses when the market is moving significantly against you. Convincing yourself that the market will eventually move in your direction if you just hold on to your position a little longer can often lead to disaster. According to professional trader, Nial Fuller:
“one of the most challenging decisions that [traders] are faced with on a day to day basis is…knowing when to hold on to a trade and when to close it.”
In his recent article “Know When to Hold ‘em…” Nial explains how to manage your trades in various market conditions. His advice includes using stop loses, and also trailing those stop loses in a rising market.
Another interesting read appeared in The Wall Street Journal this week regarding the large amount of short interest (i.e. people betting against) on RH (RH) (formerly Restoration Hardware) this year. Of course RH is a stock we’ve written about often in this article series (for example, here, here and here) and it’s also a trade that our trading models have had a lot of success with by being long. The Wall Street Journal article suggests as much as $1 billion dollars may have recently been lost by short sellers betting against this stock (which is a lot considering the market cap of RH is still less than $2 billion even after the shares have risen more than 195% this year). Despite the big gains (which have been fueled in part by massive share buybacks), plenty of short sellers remain unconvinced considering about 35% of the company’s shares are still currently sold short. Several of our models are on the other side of that trade, however our models have stop loss orders in place to prevent us from giving back our big gains.
Model Performance:
Per reader feedback, we’re continuing to share the performance of our trading models, as shown in the following table.
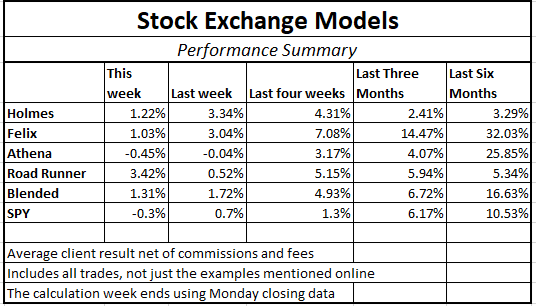
The sharp-eyed may have noticed some small changes in the performance table. We want it to be a reflection of actual client accounts. Sometimes there are some new accounts or changes that were not originally included.
Importantly, we find that blending a trend-following / momentum model (Athena) with a mean reversion / dip-buying model (Holmes) provides two strategies, effective in their own right, that are not correlated with each other or with the overall market. By combining the two, we can get more diversity, lower risk, and a smoother string of returns.
| And for these reasons, I am changing the “Trade with Jeff” offer at Seeking Alpha to include a 50-50 split between Holmes and Athena. Current participants have already agreed to this. Since our costs on Athena are lower, we have also lowered the fees for the combination. |
If you have been thinking about giving it a try, click through to this post for more information. Also, readers are invited to write to main at newarc dot com for our free, brief description of how we created the Stock Exchange models.
Expert Picks From The Models:
This week’s article is being edited by Blue Harbinger (Blue Harbinger is a source for independent investment ideas).
Holmes: I have no new purchases this week, however I did exit my position in Sally Beauty (SBH) on 12/22 after entering the trade back on 10/24.
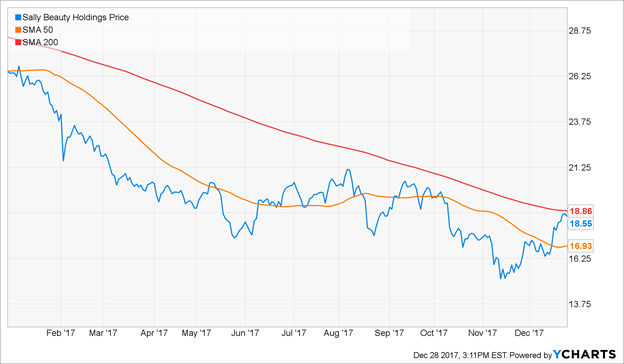
Blue Harbinger: Interesting, Holmes. I do recall discussing your purchase of Sally Beauty during the week of 10/24 in this Stock Exchange. And I think it’s nice to review sells once in a while. Why exactly did you finally decide to “fold” this trade?
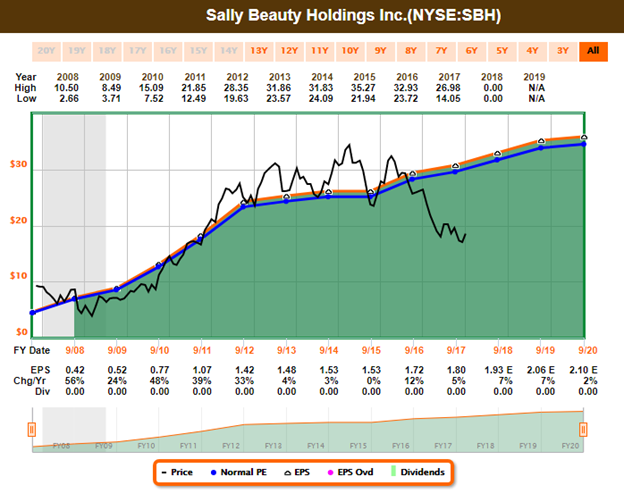
Holmes: I typically only hold for around six weeks, so this was a longer hold for me. I had a stop loss in place and macro conditions were changing. It was finally time to exit this trade, and I did so at a profit.
BH: Glad you made a little money on this one. I realize your dip buying strategy has been good, but it hasn’t been as “hot” as some of the momentum models lately. How about you RoadRunner – what have you got for us this week?
Road Runner: This week I like Take Two Interactive (TTWO). Are you familiar with this stock, Blue Harbinger?
BH: Yes, Road Runner. This is your fourth Take Two trade since May. The company makes interactive entertainment (i.e. “video games”).
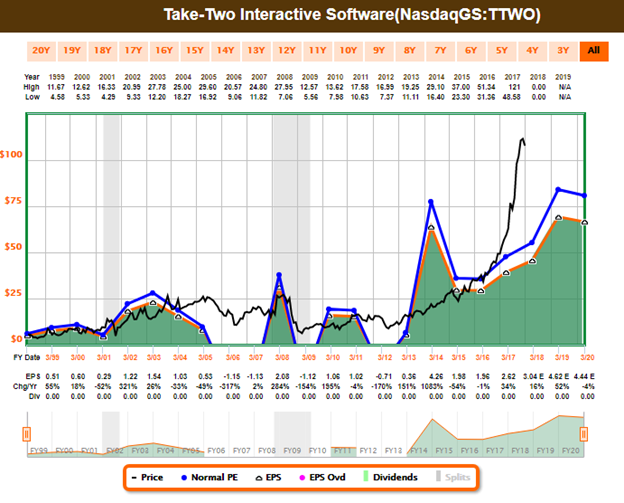
RR: Well then as you also know, I like to buy stocks that are at the bottom of a rising channel, and if you look at the chart below, you can see why I like TTWO again this week.
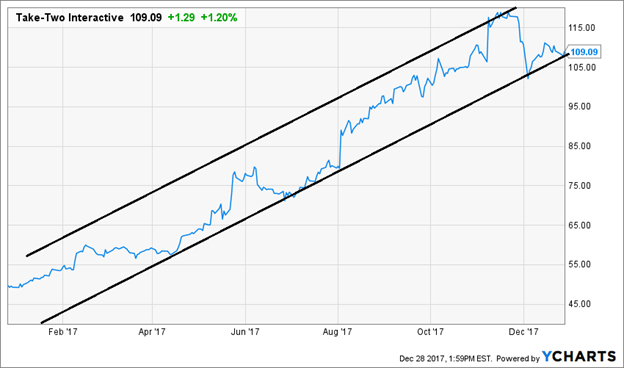
BH: Yes, Road Runner – I can see why you bought it, and I can also see this stock has been in a rising channel for most of this year, which helps explain your success on your earlier Take Two trades. Remind us, how long do you typically hold your positions, and how do you know when it’s time to exit?
RR: My typical holding period is about 4-weeks. I give my trades time to work, and if they aren’t working in my time period then I exit my position.
BH: Well – you have a decent track-record over the last six-months. Thanks for sharing this idea. How about you, Felix – do you have any trades this week?
Felix: No new trades this week, but I did exit my position in Freeport-McMoRan on Wednesday 12/27.
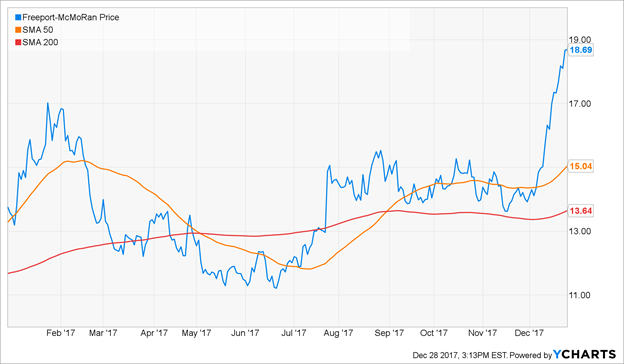
BH: Interesting Felix. Based on the above price chart, I think I know why you sold (i.e. the shares are up big this month), but why don’t you tell us – why did you sell this copper and gold mining company, Felix?
Felix: I typically hold my positions for about 66 weeks – which is much longer than the other models. I exit when my price target is hit, and I use stops and macro considerations to control risks.
BH: That makes sense.
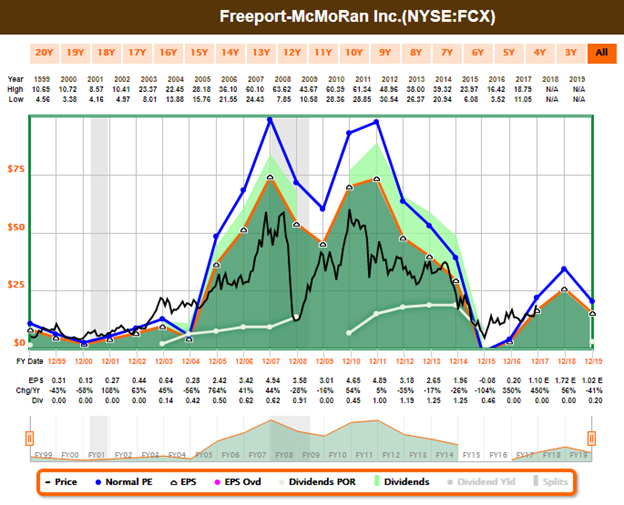
Felix: Also, this week I ran the entire Russell 1000 index (large cap stocks) through my model, and you can see the top 20 rankings in the following list.

BH: Thanks Felix. I know you are a momentum trader, so that list is interesting. How about you Oscar – what have you got for us this week?
Oscar: This week I’m sharing my top ranked global ETFs. The following list includes my top 20.

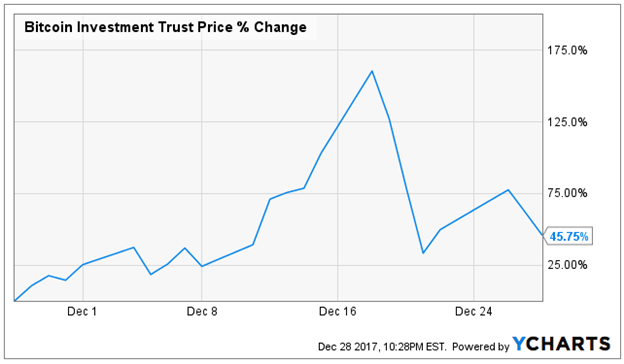
BH: Thanks Oscar. That is a very diverse group of ETFs on your list. I recall from our previous conversations that you are a momentum trader, you hold for about 6-weeks, and you control risks with stops and by rotating into a new sector. I suppose I am not surprised to see the Bitcoin Investment Trust (GBTC) at the top of a momentum list. We discussed Bitcoin in more detail a few weeks ago in this article: Do Not Invest In Bitcoin, Trade It! Bitcoin’s price has pulled back in the last week, but it has been on a wild ride over the last month, as shown in the following chart.
Conclusion:
Trading is not only about buying – that’s only half the story. Knowing when to sell your trades can be just as important. We use a combination of stops, macro factors and timeframes to determine when to exit our positions and to control risks across our varying model-based trading approaches. As Kenny Rogers says in the following video: “you’ve got to know when to hold ’em, know when to fold ’em.”
Overall, we find that a blended approach, between momentum and dip-buying, works well to deliver strong returns while also providing more diversity, lower risk, and a smoother string of returns.
Background On The Stock Exchange:
Each week, Felix and Oscar host a poker game for some of their friends. Since they are all traders, they love to discuss their best current ideas before the game starts. They like to call this their “Stock Exchange.” (Check out Background on the Stock Exchange for more background). Their methods are excellent, as you know if you have been following the series. Since the time frames and risk profiles differ, so do the stock ideas. You get to be a fly on the wall from my report. I am usually the only human present and the only one using any fundamental analysis.
The result? Several expert ideas each week from traders, and a brief comment on the fundamentals from the human investor. The models are named to make it easy to remember their trading personalities.
Stock Exchange Character Guide:
| Character | Universe | Style | Average Holding Period | Exit Method | Risk Control |
| Felix | NewArc Stocks | Momentum | 66 weeks | Price target | Macro and stops |
| Oscar | “Empirical” Sectors | Momentum | Six weeks | Rotation | Stops |
| Athena | NewArc Stocks | Momentum | 17 weeks | Price target | Stops |
| Holmes | NewArc Stocks | Dip-buying Mean reversion | Six weeks | Price target | Macro and stops |
| RoadRunner | NewArc Stocks | Stocks at bottom of rising range | Four weeks | Time | Time |
| Jeff | Everything | Value | Long term | Risk signals | Recession risk, financial stress, Macro |
Getting Updates:
Readers are welcome to suggest individual stocks and/or ETFs to be added to our model lists. We keep a running list of all securities our readers recommend, and we share the results within this weekly “Stock Exchange” series when feasible. Send your ideas to “etf at newarc dot com.” Also, we will share additional information about the models, including test data, with those interested in investing. Suggestions and comments about this weekly “Stock Exchange” report are welcome.


